It's a typical day for any scientist or engineer. You're doing some calculations while playing around with the fundamental forces of nature and... you suddenly realize that what you're doing could have fatal consequences. As in the potential death toll starts in the dozens, if not hundreds or thousands. Worst case, you find what you're doing could cause the apocalypse.
Movie fans who hung around after watching Barbie to also watch Oppenheimer as part of the "Barbenheimer" social media-inspired double feature craze recently become aware that's a thing the people that do this kind of work deal with on a daily basis. Admittedly, for many of these fans, seeing the main character of Oppenheimer getting all worked up over results of math that suggested a runaway nuclear reaction could end the world could be a real consequence of detonating an atomic bomb caused a real head rush.
So what's in the math that Robert Oppenheimer did that made him think the proverbial end of the world was something that had a non-zero chance of happening because of the work he was doing? Welch Labs explains the math Oppenheimer did in the following short video:
We now return you to the world that continued muddling through when the invention of the atomic bomb didn't cause it to end.
Labels: math, movies, technology


Since being sworn in as President of the United States, Donald Trump has devoted considerable energy to reversing many of his predecessor in office Barack Obama's actions.
But perhaps the most surprising reversal might come from undoing a January 2013 action by President Obama to reject a popular petition for the U.S. to build a working Death Star. For an administration seeking to expand the military capabilities of the United States, where the President has proposed creating a "space force", the Trump White House might soon revisit what would be the nation's largest ever defense infrastructure construction project.
Advances in production technology and fabrication methods for space-based structures stand to make the project much more feasible and cost effective than in President Obama's day, as the following video demonstrating how a Death Star could be practically manufactured demonstrates (HT: Core77):
It's really not that much different from assembling an International Space Station. And it would certainly be a lot easier to see from the ground. For a nation whose private sector can launch a Tesla into space, how hard can it be for the government to do?
Yes, the second video is real!
Labels: movies, satire, technology
The production team behind the Blade Runner 2049 movie opening in theaters today had a lot of creative energy to spare. So much so that they put together three shorts to explain what major events happened from the end of the original Blade Runner, which was set in the Los Angeles of 2019, and the beginning of the new motion picture.
The first short, at least in chronological order if not the order the shorts were released, features the animation work of Shinichiro Watanabe, who is perhaps best known for the Cowboy Bebop anime series, starts the ball rolling for what happened to Los Angeles - Blade Runner Black Out 2022:
The second short features Jared Leto's character, Niander Wallace, whose company was allowed to produce new replicants after a decade of prohibition - Blade Runner 2036: Nexus Dawn: The third short follows Dave Battista's character, Sapper Morton, whose actions set the immediate stage for what happens in the new movie - Blade Runner 2048: Nowhere to Run: Where was this movie all summer long?
Labels: academy awards, movies
Several weeks ago, we compared the box office performance of the movie Deadpool against its eight 2015 Best Picture Academy Award-nominated peers. Back then, we found that the scrappy Deadpool beat all eight films through its first week of release.
Today, we're producing the sequel to that original story, where this time, we find that the eight Best Picture nominees of 2015 have struck back, taking the cumulative box office crown away from 2016's Deadpool.

It really shouldn't be a surprise, but you should always expect that eight movies, even 2015's Best Picture nominees, will combine to make more money at the box office than just one movie.
The real story here is how the eight 2015 Best Picture nominees did it. Basically, they added another 8,400 theaters in their third week of release to their previous week's total of 10,487, dwarfing the peak of 3,836 for Deadpool by nearly a factor of 5.
And then, in their fourth week of release, they added another 566.
It was like one of those cliché fight scenes in a superhero movie where the evil league of supervillains start fighting really dirty by ordering their henchmen to "sic 'em" in the hopes of overwhelming their greatly outnumbered foe.
But what if the odds were equalized? What if we calculated the average gross per theater for each day of release for all these movies, and then compared their box office prowess, mano a mano?
Here's the chart showing the results of that daily calculation for the first four weeks of release for Deadpool and the eight 2015 Best Picture nominees.

And here's how it looks when we add up the cumulative average box office per theater take.
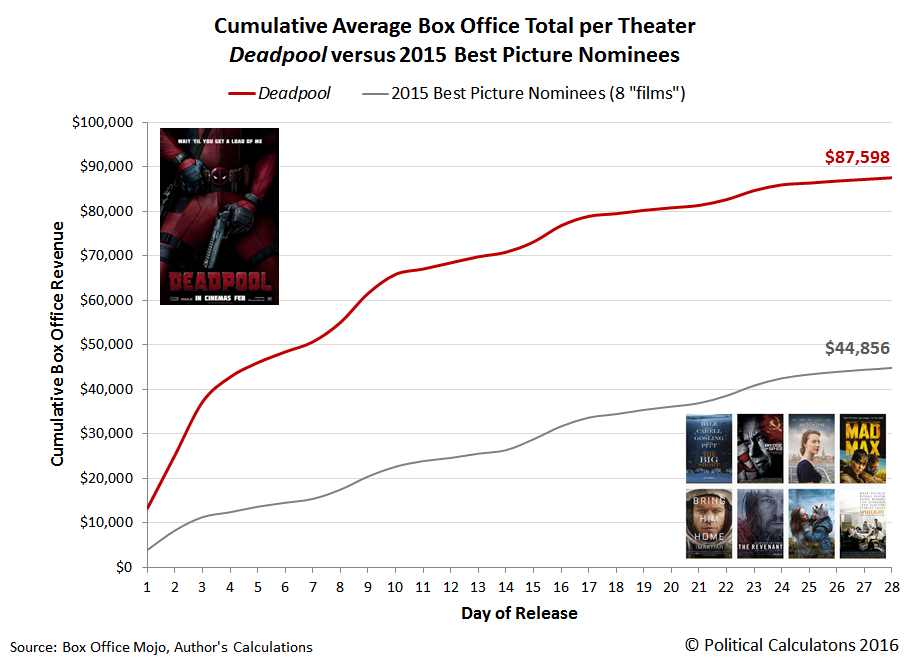
In this last chart, we confirm that Deadpool is nearly twice the movie that the eight Best Picture nominees of 2015 are where performance in Hollywood matters most. At the box office.
But here's the best part - the winner of the Academy Award for Best Picture and Pretentiousness in 2015, Spotlight, is going to have a sequel. So at some point in the future, we're going to get a rematch. Alas, without The Revenant 2.
Just like in the movies!
Labels: academy awards, business, movies
 We think there's something seriously wrong with the people who make movies in Hollywood. Specifically, the people who keep spending millions and millions of dollars to make box office flops in pursuit of making the definitive modern anti-Iraq war/War on Terror movie.
Fortunately, that's all over with now that The Hurt Locker has definitively been crowned as the best modern anti-Iraq war/War on Terror movie ever made, thanks to its winning of the Academy Award for Best Picture of 2009. Finally, Hollywood's power elite can turn its collective attention back to making big screen versions of old television shows!
And just as definitively, The Hurt Locker turned out to be a complete flop at the U.S. box office, having accumulated an estimated $16.4 million in receipts throughout its 147 days in the theaters, spanning 26 June 2009 through 19 November 2009. With a production cost of $15 million though, at least it wasn't a complete bust on that level, although Hollywood's notorious accounting will say otherwise....
Still, what brings all this up is the performance of Green Zone at the box office during its opening weekend. Here, according to Reuters, the movie collected $14.5 million in just its first three days, which was a major disappointment:
"Green Zone" opened at a distant No. 2 in North America with $14.5 million. Distributor Universal Pictures, which axed its top executives last fall after a poor run at the box office, had hoped for a slightly better showing.
"It's a bit of a disappointment," said Nikki Rocco, president of distribution at the General Electric Co unit.
Damon plays a U.S. soldier questioning the supposed existence of weapons of mass destruction shortly after the U.S.-led invasion of Iraq. Reviews were mixed.
The $100 million movie was directed by British filmmaker Paul Greengrass, who collaborated with Damon on the second two movies in the "Bourne" action trilogy. Those opened to $52.5 million and $69 million, respectively.
Rocco noted "Green Zone" did better than most other entries in the Iraq war genre, including Oscar best picture winner "The Hurt Locker," which has earned about $16 million since June.
That made us wonder. Is Rocco right? Should she be trumpeting the relative performance of Green Zone with respect to the other members of the anti-Iraq war/War on Terror film genre?
We decided to find out. We went back and got the box office data for both The Kingdom and Rendition, 2007's most noteworthy efforts in that acclaimed film genre, with The Kingdom being the top grossing major release in the genre and Rendition as the previous title holder for the lowest. Let's look first at how these two films performed back in 2007, when they went virtually head-to-head against each other in the fall of that year.
 Comparing the daily gross per theater of both The Kingdom and Rendition from Box Office Mojo, we find that Rendition's financial performance was truly awful. Released three full weeks after The Kingdom, as the number of theaters showing that film dropped to 1,730 from its peak of 2,836 theaters in the previous week, Rendition barely had a higher total box office take per theater, despite being brand new and showing in 2,250 theaters, some 520 more than The Kingdom. Small wonder then that Rendition got pulled from theaters after just 21 days.
Next, to compare these movies with Green Zone, we adjusted the daily gross per theater data for each to be expressed in terms of 2010 U.S. dollars.
 Our next chart then compares each film's daily inflation-adjusted gross per theater for each day of its release, which allows us to do a direct side-by-side comparison of their box office performance. By this measure, we see that Green Zone falls between both The Kingdom and Rendition, at least through its first ten days of release. We also see that Green Zone would appear to be holding its relative position with respect to the daily gross per theater by day of release generated by its 2007 peers in the film genre, even as it is being shown in over 3000 theaters, which perhaps accounts for its larger overall gross.
This observation suggests that Nikki Rocco is right, although that's certainly not much to brag about in the low revenue generating genre of anti-Iraq war/War on Terror films.
It occurs to us though that daily gross per theater isn't what defines a Tinseltown bomb. Instead, what decides if a major motion picture is a flop is how much it makes at the box office with respect to how much it cost to produce.
What we did next then was to look at each movie's total take from the ticket window during its opening weekend, which would be the point at which movie studio managers would be making key decisions about how long they would really keep each movie in the theaters, converting this figure into constant 2010 U.S. dollars. Since we observe that each of the films maintains a relatively steady position with respect to each other for each day of release, this approach of just looking at the relative success of each based on its opening weekend performance should be sufficient to evaluate the financial performance of each with respect to each other.
We then divided the inflation-adjusted opening weekend gross for each movie by its cost of production, converting the results into a percentage value. Our following chart illustrates what we found.
 We see that The Kingdom made back 23.4% of its production cost in its opening weekend, confirming its place as the top grossing film in the anti-Iraq war/War on Terror film genre. Things get more interesting though when we compare Rendition with Green Zone.
Here, we see that Rendition actually outperformed Green Zone at the box office! Rendition made back 14.8% of its production cost in its first weekend, while Green Zone only collected 14.3% of its production cost in its opening three-day weekend.
It would seem then that Green Zone is a bigger box office bomb than Rendition. Worse, unlike The Hurt Locker, it's unlikely that Green Zone will remain in theaters long enough to recoup its production costs and make money. We would estimate its total life expectancy at the box office to be somewhere around 5-6 weeks. Nikki Rocco is wrong!
Labels: academy awards, box office, business, movies
Last year, we looked at 30 years of box office totals for Best Picture winners and we wondered how much does winning an Academy Award boost the box office numbers for the movies on the winner's list:
To answer that question, let's first look at their box office totals as of March 1, 2006, ranked from highest to lowest (all figures may be considered to be equivalent to 2005 U.S. dollars):
- Brokeback Mountain: $75,838,000 - BEST DIRECTOR
- Crash: $53,404,817 - BEST PICTURE WINNER
- Munich: $46,178,425
- Good Night, and Good Luck: $30,455,120
- Capote: $23,441,493 - BEST ACTOR WINNER
The box office has long since closed for each of the films nominated for Best Picture of 2005 and we now have the results, which might tell us what effect winning an Academy Award delivers for each movie's box office numbers. The results are summarized in the table below (award winners are shown in boldface):
| Best Picture Nominee's Pre and Post Oscar U.S. Domestic Box Office Totals | ||||
|---|---|---|---|---|
| Best Picture Nominee | Pre-Award Box Office | Post-Award Box Office | Post-Award Change | Percent of Pre-Award Box Office |
| Brokeback Mountain | $75,838,000 | $83,043,761 | $7,205,761 | 9.5% |
| Capote | $23,441,493 | $28,750,530 | $5,309,037 | 22.6% |
| Crash | $53,404,817 | $54,580,300 | $1,175,483 | 2.2% |
| Munich | $46,178,425 | $47,403,685 | $1,225,260 | 2.7% |
| Good Night, and Good Luck | $30,455,120 | $31,558,003 | $1,102,883 | 3.6% |
Here's what we observed about these movies last year:
By and large, what these figures tell us is that at this point, whatever 2005 nominee goes on to win the award for Best Picture will rank among the least popular of all Best Picture winning movies over the past 30 years. Only Brokeback Mountain, with its exceptionally well-executed marketing plan, breaks over the very low hurdle set by 1987’s The Last Emperor, which was noted in that year as having been seen in theaters by remarkably few people.
To be fair, the jury this year is still out for Capote, which is only now coming into wide release. What will be interesting to see is whether Academy voters will give the Oscar to the nominee that has already made the most money (Brokeback Mountain) or will give it to the movie that has the most to gain in box office revenue from winning at this point (Capote). That assumes that Hollywood doesn't have some other agenda they're pursuing this year with its most recognized awards.
With a post-award pickup of 22.6% of its pre-award box office following Phillip Seymour Hoffman's Best Actor award, just imagine how big a pretty obscure art-house movie like Capote's take would have been if it had won Best Picture instead! Likewise, Brokeback Mountain was able to take in an additional 9.5% of its pre-Academy Award box office, even though it reached its widest distribution in U.S. theaters nearly a month earlier.
By contrast, Best Picture winner Crash was re-released into just 150 theaters the week after the Academy Awards were announced, limiting the ability to generate significant income fro this venue. Crash's additional box office was also hurt by the movie already having been released to the home video market back in September 2005.
For movie-makers, this result does suggest why "serious" Oscar contenders are released very late in the year, as the box office for films put out earlier (Crash and Good Night, and Good Luck) doesn't seem to benefit much from winning, especially if they're already released to DVD.
Now, those DVD sales are a different matter that we might look at next year!
What About This Year's Top Pictures?
Here's the box office totals as of Tuesday, February 20 for this year's Best Picture nominees:
- Babel: $33,218,792
- The Departed: $131,498,360
- Letters from Iwo Jima: $11,811,634
- Little Miss Sunshine: $59,758,048
- The Queen: $51,350,148
We'll see what happens after the awards are announced this Sunday. And for those who remember what we think of the Academy Awards ceremony, we still won't be watching....
Labels: academy awards, box office, movies
Next Sunday, Hollywood will hold the world hostage, again, as it broadcasts the Academy Awards for motion pictures first screened in 2005, live. After compelling the viewing audience to watch several hours of lame acceptance speeches, jokes, dance numbers, musical performances and close-ups of celebrities who apparently had nothing better to do on a Sunday evening than participate in what might be fairly, if not accurately, described as torture, an envelope will be opened that will reveal what film the Academy of Motion Picture Arts and Sciences have, in their infinite collective wisdom, determined to be the best, yes the very best, motion picture of 2005. 2005 being perhaps the single most significant and auspicious year for achievements in motion pictures since the Academy Awards themselves were first launched in 1929.
Or not. As you might have already guessed, we here at Political Calculations(TM) are singularly unimpressed with what we’ve come to expect from experience to be a night of celebration of what we might call utterly pretentious crap. We are, of course, referring to the ceremony itself and not necessarily the motion pictures. What we can’t help but notice however, is that the Best Picture winners tend to make buckets of money, which is, after all, why motion pictures get made in the first place.
How much money you ask? The answer to that question lies in the dynamic table we present below – drawing the raw numbers for the U.S. domestic box office for each best picture winner for the last 30 years from Box Office Mojo. We’ve also gone a step further – adjusting the basic figures for inflation to be in 2005 U.S. dollars. Finally, we compare the best-picture winner to the top money-making motion picture of its year by finding what percentage of the top grossing movie’s business the Oscar winner took in (a score of 100% indicates that the Oscar winner was the top money-making movie of that year!)
You may sort the data below by clicking the column headings – either from low to high or from high to low (by clicking the column heading a second time.) Go ahead, you know you want to!
| 30 Years of Box Office Totals for Best Picture Winners |
|---|
| Year | Title | U.S. Box Office Totals (Not Adjusted for Inflation) | U.S. Box Office Totals (Adjusted for Inflation) | Percentage of Year's Top Box Office Draw |
|---|---|---|---|---|
| 1975 | One Flew Over the Cuckoo's Nest | 108,981,275 | 396,295,545 | 41.9 |
| 1976 | Rocky | 117,235,147 | 402,869,921 | 100.0 |
| 1977 | Annie Hall | 038,251,425 | 123,391,694 | 8.3 |
| 1978 | Deer Hunter, The | 048,979,328 | 146,644,695 | 26.0 |
| 1979 | Kramer Vs. Kramer | 106,260,000 | 285,645,161 | 100.0 |
| 1980 | Ordinary People | 054,766,923 | 123,907,066 | 18.9 |
| 1981 | Chariots of Fire | 058,972,904 | 126,823,449 | 24.3 |
| 1982 | Gandhi | 052,767,889 | 106,817,589 | 12.1 |
| 1983 | Terms Of Endearment | 108,423,489 | 212,595,076 | 42.9 |
| 1984 | Amadeus | 051,564,280 | 096,925,338 | 21.6 |
| 1985 | Out Of Africa | 087,071,205 | 158,023,966 | 41.3 |
| 1986 | Platoon | 138,530,565 | 246,935,053 | 78.4 |
| 1987 | Last Emperor, The | 043,984,230 | 075,574,278 | 26.2 |
| 1988 | Rain Man | 172,825,435 | 285,190,487 | 100.0 |
| 1989 | Driving Miss Daisy | 106,593,296 | 167,863,458 | 42.4 |
| 1990 | Dances With Wolves | 184,925,486 | 276,420,756 | 64.7 |
| 1991 | Silence Of The Lambs, The | 130,742,922 | 187,579,515 | 63.8 |
| 1992 | Unforgiven | 101,157,447 | 140,887,809 | 46.5 |
| 1993 | Schindler's List | 096,065,768 | 129,818,605 | 26.9 |
| 1994 | Forrest Gump | 329,694,499 | 440,179,571 | 100.0 |
| 1995 | Braveheart | 075,609,945 | 096,935,827 | 29.4 |
| 1996 | English Patient, The | 078,676,425 | 097,978,113 | 25.7 |
| 1997 | Titanic | 600,788,188 | 730,885,873 | 100.0 |
| 1998 | Shakespeare In Love | 100,317,794 | 120,141,071 | 46.3 |
| 1999 | American Beauty | 130,096,601 | 152,516,531 | 30.2 |
| 2000 | Gladiator | 187,705,427 | 212,817,944 | 72.2 |
| 2001 | Beautiful Mind, A | 170,742,341 | 188,249,549 | 53.8 |
| 2002 | Chicago | 170,687,518 | 185,328,467 | 42.3 |
| 2003 | Lord of the Rings: The Return of the King, The | 377,027,325 | 400,241,322 | 100.0 |
| 2004 | Million Dollar Baby | 100,492,203 | 103,921,616 | 22.8 |
Well, that was an experience, wasn’t it? In only six of the last thirty years did the biggest money-making (and therefore, most popular) movie of its year go on to be the Best Picture winner. Plus, who would have guessed that in terms of today’s dollars, 1977’s Annie Hall would rank as a major blockbuster? We're still trying to wrap our brains around that one!
More to the point, what the inflation adjusted figures in the table above do for us is to give us a way to compare the popularity of the best picture winners with each other, as measured by equivalent dollars earned. By converting each winner's box office earnings to current U.S. dollars, we can get a sense of the relative size of its audience, which should be directly in proportion to its earnings.
What does all this mean for the nominees for 2005’s Best Picture award? To answer that question, let's first look at their box office totals as of March 1, 2006, ranked from highest to lowest (all figures may be considered to be equivalent to 2005 U.S. dollars):
- Brokeback Mountain: $75,838,000
- Crash: $53,404,817 - BEST PICTURE WINNER
- Munich: $46,178,425
- Good Night, and Good Luck: $30,455,120
- Capote: $23,441,493
By and large, what these figures tell us is that at this point, whatever 2005 nominee goes on to win the award for Best Picture will rank among the least popular of all Best Picture winning movies over the past 30 years. Only Brokeback Mountain, with its exceptionally well-executed marketing plan, breaks over the very low hurdle set by 1987’s The Last Emperor, which was noted in that year as having been seen in theaters by remarkably few people.
To be fair, the jury this year is still out for Capote, which is only now coming into wide release. What will be interesting to see is whether Academy voters will give the Oscar to the nominee that has already made the most money (Brokeback Mountain) or will give it to the movie that has the most to gain in box office revenue from winning at this point (Capote). That assumes that Hollywood doesn't have some other agenda they're pursuing this year with its most recognized awards.
No matter how it plays out, isn’t that more entertaining than watching the Oscars?
Correction: Changed "Monday" to "Sunday" in the first paragraph. Twice. Still not going to watch it.
Update (5 March 2006) - post Oscars: Thanks to Captain Ed's liveblogging, I didn't have to watch the annual train wreck that is the Academy Awards! Updated post to reflect Crash's Best Picture win. Hopefully, Capote will be able to pump up its totals based upon Philip Seymour Hoffman's win for Best Actor. Still, for Hollywood, an out-of-touch year with the consumer all-round.
And speaking of Oscar's Best Picture box office - Box Office Mojo has updated their Best Picture winning box office list to incorporate Crash's data. Sure, it's nice - but they don't adjust for inflation (although they do show how many Oscar nominations and wins going back to 1978!)
Labels: academy awards, box office, movies
Welcome to the blogosphere's toolchest! Here, unlike other blogs dedicated to analyzing current events, we create easy-to-use, simple tools to do the math related to them so you can get in on the action too! If you would like to learn more about these tools, or if you would like to contribute ideas to develop for this blog, please e-mail us at:
ironman at politicalcalculations
Thanks in advance!
Closing values for previous trading day.
This site is primarily powered by:

CSS Validation

RSS Site Feed

JavaScript
The tools on this site are built using JavaScript. If you would like to learn more, one of the best free resources on the web is available at W3Schools.com.
Other Cool Resources
Blog Roll


