Investors got to go on a wild roller-coaster ride of volatility during the last two weeks. The U.S. stock market has not just been swinging wildly from highs to lows during the course of daily trading.
Whether you're just an observer, an investor, or an analyst, it's certainly an exciting time. To help put today's volatility into some historical context, we've updated our long-term chart of the percentage change the S&P 500 and its aggregated market capitalization-weighted component stocks have gone through over the index' history.
Or rather, for each trading day for which we have data for the index and its predecessor indices and components from 3 January 1950 through 11 April 2025, which spans the modern era for the U.S. stock market. The chart condenses that 75 years of day-to-day trading activity into a statistical control chart-style presentation, which identifies several distinct thresholds for measuring the market's daily behavior. Here's the chart:

Over the past 18,940 trading days covered in this chart, the average day-to-day change in the S&P 500 rounds up to +0.04%. We can also see that the index has changed from its previous trading day's closing value by 0.99% (one standard deviation) or less on 79.1% of all the trading days from 3 January 1950 through 1 March 2024.
This concentration of day-to-day changes in its value that fall within one standard deviation of the mean is important. If the day-to-day variation of the index were accurately described by a normal Gaussian distribution, we would expect to see around 68.2% of all changes within that range. Instead, there are far more small changes than would be expected if that hypothesis held. At the same time, there are more "large" changes that would be expected if a normal distribution applied, which is what market analysts mean when they describe stock prices as having "fat tails".
These aspects are characteristics of a Lévy distribution, which is another class of stable distribution about a central trend. As we've discovered however, there's some overlap with a standard Gaussian distribution, which makes some of the tools used to analyze these "normal" distributions useful in analyzing daily stock price variation.
That overlap occurs at the plus-and-minus two standard deviation thresholds, which is we use to define an "interesting" day for the S&P 500. The standard deviation of the day-to-day change in the S&P 500 is just under one percent. Since 95% of these changes are within two standard deviations of the mean trend line, any change of two percent or more is relatively rare, which makes it interesting by this definition.
As the chart illustrates, these rare events are not evenly distributed. They occur in clusters with both unusually large positive changes and negative changes taking place in close proximity to each other.
That brings us to the newest volatility cluster, which got underway with President Donald Trump's announcement of global tariffs being imposed on the imports of all nations to the U.S. after the market closed on Wednesday, 2 April 2025. Starting from that date, the day-to-day percentage change in the S&P 500 index has exceeded the 2% threshold on four of seven trading days through Friday, 11 April 2025.
That's somewhat deceptive because the intraday swings from highs to lows and back again in the index during some of the days that had little overall change have been truly impressive.
Take what happened on 9 April 2025 when President Trump paused the reciprocal tariffs announced for all nations but China a week earlier. The day-to-day change was +9.52%, which now ranks as the third-highest ever daily gain for the index in the modern era. But if not for what appears to be late-day profit taking, it could have been bigger and maybe even the biggest.
The two bigger daily gains both occurred in the volatility cluster of October 2008, coinciding with the near-collapse of the U.S. auto industry and the 2008 Financial Crisis.
Which brings us to our final point. That kind of outsized daily gain typically occurs only during periods of great volatility and tends to follow substantial losses. Because it does, it qualifies as a bear market rally.
Bear market rallies tend to be temporary events. Perhaps this time is different given the artificial nature of how the latest volatility cluster began. Market history and logic argues against it.
The magnitude of the tariff event is such that we expect high volatility to continue because it exposed previously hidden weaknesses in the market that can no longer be glossed over by investors. Reckonings will now happen because they must, they can no longer be avoided. Whole new sets of winners and losers within the market will emerge because of it.
Are you ready to keep riding the roller coaster?
References
Yahoo! Finance. S&P 500 Historical Data. [Online Database]. Accessed 11 April 2025.
Volker Ziemann. Bubbles, Crashes, Fat Tails and Lévy-Stable Distributions. Physics and Finance. pp 113-143. DOI: 10.1007/978-3-030-63643-2_9. 19 January 2021.
Takumi Fukunaga and Ken Umeno. Universal Lévy’s stable law of stock market and its characterization. [ArXiv Preprint: PDF Document.] 20 February 2018.
Labels: SP 500, volatility


When it comes to volatility, the last two years have been very quiet ones for the S&P 500 (Index: SPX) .
That realization struck us as we recently updated our volatility statistics for the index. We define "quiet" in terms of the standard deviaton of the day-to-day percentage change in the value of the S&P 500. To qualify as quiet, that day-to-day change has to be less than three-standard deviations, where a single standard deviation represents 0.99% of the index' value. With respect to the S&P 500's long-running mean daily change of 0.036% since 3 January 1950, the index stops being quiet if it either rises by 3.01% or falls by 2.94% in value from the previous day's close.
Since 30 November 2022, the S&P 500 has experienced a total of one "non-quiet" day: 5 August 2024. The S&P dropped by 3.00% on that day, when it was rattled by a sudden crisis caused by a policy mistake by Japan's central bank. Here's how we summarized the story:
The S&P 500 (Index: SPX) got rattled on Monday, 5 August 2024, losing a full three percent of its value in a single day.
That's not a typical day for the index. Before 5 August 2024, there have been just 140 declines greater than 2.94% from previous trading day's closing value recorded since 3 January 1950. Now there are 141.
And yet, after all that sound and fury to start the week, the S&P 500 had almost fully recovered all that it had lost by the end of the week, as if the index had simply gone mostly sideways during the trading week that was. The index ended the trading week at a level of 5,344.16, just 2.4 points less than where it closed the previous week.
The big story of the week came out of Japan, when the combination of the BOJ's surprise rate hike combined with bad jobs data in the U.S. to start unwinding the "carry trade" based on the difference between Japan's low interest rates and higher rates everywhere else.
Markets went on to recover after the Bank of Japan quickly backed off its plans to continue hiking rates to fight inflation developing in Japan. Although it took the rest of the week, as shown in the latest update of the alternative futures chart.
Although the trajectory of the S&P 500 briefly deviated from it in what we'll call the Japan carry trade noise event, an event others describe as a "big ol' nothingburger", the chart indicates stock prices recovered enough to continue falling within the range associated with investors focusing on the distant future quarter of 2025-Q2.
We have to go back to 30 November 2022 to find the previous trading day that qualified as "not quiet". Here's our chart tracking the day-to-day volatility of the S&P 500 since 3 January 1950, with the index' fully updated volatility statistics through 20 November 2024:

How long do you suppose the U.S. stock market's relative period of quiet might last?
References
Yahoo! Finance. S&P 500 Historical Data. [Online Database]. Accessed 20 November 2024.
Image credit: Microsoft Copilot Designer. Prompt: A stock price candlestick chart with positive and negative changes".
Labels: SP 500, volatility
The S&P 500 (Index: SPX) is sometimes very volatile. But much more often, it is not.
That characteristic is driven home in our chart tracking the day-to-day percentage change in the S&P 500 in the modern era for the U.S. stock market.
Here, we can see that over the past 18,661 trading days for which we have data, the average day-to-day change in the S&P 500 is +0.04%. We can also see that the index has changed from its previous trading day's closing value by 0.99% (one standard deviation) or less on 79.1% of all the trading days from 3 January 1950 through 1 March 2024.
When we expand that range of trading day-to-day volatility out to two standard deviations, or daily changes of a little under 2% or less from the mean, we find that 95.4% of daily percentage changes in the index fall within that wider range. By statistical definition, things get more interesting when we look at trading day-to-day changes that are bigger than that. But even so, we find 98.6% of the daily volatility of the S&P 500 falls within a limit of three standard deviations of the mean daily change.
Of the 18,661 trading days for which we have data, we find just 122 (0.65%) where the S&P 500 increased by more than three standard deviations and 140 (0.75%) where the decreased by more than three standard deviations with respect to the mean daily change.
We also can see that larger volatility tends to happen in clusters, with big negative changes and big positive changes in close proximity to each other.

As for the best and worst days recorded by the S&P 500 index over this period, the worst negative day of trading was a 20.5% decline on 19 October 1987, in a market event now known as Black Monday 1987.
The best positive day was a 11.6% increase on 13 October 2008, which occurred in a cluster of volatility that, on the whole, was negative because it coincided with the collapse of the U.S. automotive industry during the "Great Recession" of 2008-09 and its associated stock market crash.
Perhaps the most interesting characteristic of the S&P 500 is the concentration of day-to-day changes in its value that fall within one standard deviation of the mean. If the day-to-day variation of the index were accurately described by a normal Gaussian distribution, we would expect to see around 68.2% of all changes within that range. Instead, there are far more small changes than would be expected if that hypothesis held. At the same time, there are more "large" changes that would be expected if a normal distribution applied, which is what market analysts mean when they describe stock prices as having "fat tails".
Both these properties are characteristics of a Lévy Distribution, which is another kind of stable distribution.
References
Yahoo! Finance. S&P 500 Historical Data. [Online Database]. Accessed 2 March 2024.
Volker Ziemann. Bubbles, Crashes, Fat Tails and Lévy-Stable Distributions. Physics and Finance. pp 113-143. DOI: 10.1007/978-3-030-63643-2_9. 19 January 2021.
Takumi Fukunaga and Ken Umeno. Universal Lévy’s stable law of stock market and its characterization. [ArXiv Preprint: PDF Document.] 20 February 2018.
Image credit: Microsoft Copilot Designer. Prompt: A stock price candlestick chart with positive and negative changes".
Labels: SP 500, volatility
It's not your imagination. The 2020s are shaping up to become the most volatile period in modern stock market history.
For proof, here's a visual comparison of the standard deviation of the day-to-day percentage change in the S&P 500 by decade.

Believe it or not, stock price volatility has settled down somewhat since last year!
References
Yahoo! Finance. S&P 500 Historical Data. [Online Database]. Accessed 22 July 2022.
Previously on Political Calculations
Labels: SP 500, stock market, stock prices, volatility
Statistically speaking, day-to-day changes in the S&P 500 (Index: SPX) don't start to be interesting until the index changes by more than two percent from its previous day's closing value. But those day-to-day changes get really interesting when the S&P 500 changes by more than three percent from its previous day's closing value.
That's because big changes like that don't happen very often. Going back to 3 January 1950, for the 18,198 days through 27 April 2022 where we have the data to tell how much the index gained or lost from where it ended on the previous day's trading, just 239 involved the index gaining or losing more than 3.00%. That's 1.3% of all the trading days in the index' modern era.
The following chart updates our visualization of that day to day volatility, where the dashed red lines roughly coincide with when the S&P 500's volatility has gotten really interesting.
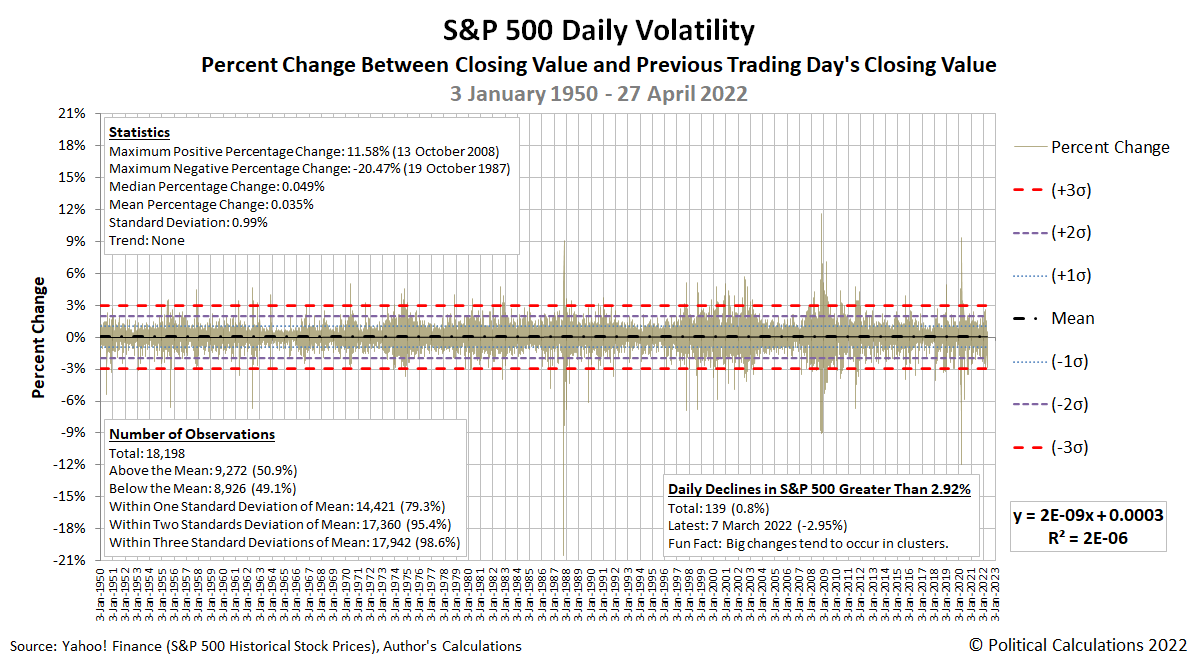
The index has experienced two trading days in the past week where it has gotten close to becoming really interesting. Friday, 22 April 2022 saw the index fall by 2.77%, while Tuesday, 26 April 2022 saw the S&P drop by 2.81%. We're pointing these recent changes out because when the S&P 500 experiences big changes like these, they tend to be clustered together in time. Which is to say that once they show up, they tend to keep showing up until the market's volatility dies down.
They also tend to be roughly balanced between gains and losses, with the number of big daily gains being nearly equal to the number of big daily losses. Today, the market's big gain/loss ratio is 118/121.
Here's the question to answer: How long might it be until what looks like a developing volatility cluster for the S&P 500 causes the index to cross the line and become really interesting by our standards?
Labels: SP 500, volatility
Long streaks and especially long losing streaks in the S&P 500 have become much less common during the past 20 years.
That change has come however as stock prices themselves have become more volatile. The following chart visualizes the daily percentage change from the previous days close for the S&P 500 from 3 January 1950 through 30 June 2021.

In this chart, we see that large daily percentage changes have become more common in recent decades. To simplify the visualization of that change, we're calculated the standard deviation of the daily percentage change in the S&P 500 by decade, presented in the next chart, where we find the typical volatility among the U.S. stock market's largest stocks by market capitalization has increased.

The final bar, for the 2020's, differs from the others in that it doesn't cover a full decade's worth of stock price changes. It covers the typical volatility observed to date in the year and a half from 2 January 2020 through 30 June 2021.
Still, it's a big jump over the preceding decade long periods, where we also see that the S&P 500 index in the decades of the 2000s have been considerably more volatile than the five decades that preceded them. The increase in the typical standard deviation indicates by decade bigger daily changes in stock prices have become more common in the 2000s.
That change offers a potential explanation for why losing streaks have become less common over the same period. Since the stock price volatility as measured by standard deviation has become larger than in previous decades, indicating larger daily changes when volatility breaks out, stock prices more quickly reach thresholds where investors buy the dips, which translates into shorter losing streaks.
Exit question: how profitable is buying big dips as a trading strategy?
References
Yahoo! Finance. S&P 500 Historical Data. [Online Database]. Accessed 2 July 2021.
Previously on Political Calculations
Labels: data visualization, SP 500, volatility
Prompted by China's latest escalation of its trade war with the United States, with China's central bank allowing the Chinese yuan to decline in value relative to the U.S. dollar with the apparent blessing of top Chinese government officials, the S&P 500 (Index: SPX) suffered a 2.98% drop on Monday, 5 August 2019, with the index closing the day at $2,844.74.
In doing so, the S&P 500 completed its fourth Lévy flight event of 2019 as investors fully shifted their forward-looking focus from the distant future quarter of 2020-Q1 just a week earlier toward the nearer future quarter of 2019-Q4.

That large percentage change qualifies the stock market's volatility on Monday, 5 August 2019 as interesting, where we consider an interesting level of volatility as occurring whenever the closing daily value of stock prices changes by more than 2% from the previous trading day's closing value, for statistical reasons.
But with a change in value of nearly 3% from the previous day's close, that represents an even more interesting threshold for "interesting", as that level falls more than three standard deviations outside of the mean day-to-day change recorded in the S&P 500 over every trading day from 3 January 1950 through 5 August 2019, where only 1.4% of all 17,510 trading days recorded during this period have seen similarly large changes from the previous day's closing value, which are roughly equally split between increases and decreases.

Focusing on just the decreases, there have been just 131 recorded in the more than 69 years from 3 January 1950 through 5 August 2019. We've recorded the data for each the S&P 500's worst ever one day declines recorded during the modern era of the U.S. stock market in the following dynamic table, where you can click the column headings for Date, Open, High, Low, Close, and Percent Change from Previous Close, you can sort the data from either high-to-low, or from low-to high. If you're accessing this article from a site that republishes our RSS news feed, please click through to our site to access a working version of the dynamic table.
| Worst 131 Single Day Declines in S&P 500 During Modern Era for U.S. Stock Market |
|---|
| Date | Previous Day's Close | Open | High | Low | Close | Percent Change from Previous Close |
|---|---|---|---|---|---|---|
| 1950-06-26 | $19.14 | $18.11 | $18.11 | $18.11 | $18.11 | -5.38% |
| 1950-06-29 | $18.11 | $17.44 | $17.44 | $17.44 | $17.44 | -3.70% |
| 1950-11-28 | $20.18 | $19.56 | $19.56 | $19.56 | $19.56 | -3.07% |
| 1950-12-04 | $19.66 | $19.00 | $19.00 | $19.00 | $19.00 | -3.36% |
| 1953-02-09 | $26.51 | $25.69 | $25.69 | $25.69 | $25.69 | -3.09% |
| 1955-09-26 | $45.63 | $42.61 | $42.61 | $42.61 | $42.61 | -6.62% |
| 1955-10-10 | $42.38 | $41.15 | $41.15 | $41.15 | $41.15 | -2.90% |
| 1957-10-21 | $40.33 | $39.15 | $39.15 | $39.15 | $39.15 | -2.93% |
| 1961-04-18 | $68.68 | $66.20 | $66.20 | $66.20 | $66.20 | -3.61% |
| 1962-05-28 | $59.47 | $59.15 | $59.15 | $55.42 | $55.50 | -6.68% |
| 1962-06-04 | $59.38 | $59.12 | $59.12 | $57.14 | $57.27 | -3.55% |
| 1973-11-19 | $103.88 | $103.65 | $103.65 | $100.37 | $100.71 | -3.05% |
| 1973-11-26 | $99.44 | $98.64 | $98.64 | $95.79 | $96.58 | -2.88% |
| 1974-07-08 | $83.66 | $83.13 | $83.13 | $80.48 | $81.09 | -3.07% |
| 1974-10-23 | $73.13 | $72.81 | $72.81 | $70.40 | $71.03 | -2.87% |
| 1974-11-18 | $71.91 | $71.10 | $71.10 | $68.95 | $69.27 | -3.67% |
| 1979-10-09 | $109.88 | $109.43 | $109.43 | $106.04 | $106.63 | -2.96% |
| 1980-03-17 | $105.43 | $105.23 | $105.23 | $101.82 | $102.26 | -3.01% |
| 1980-03-24 | $102.31 | $102.18 | $102.18 | $98.88 | $99.28 | -2.96% |
| 1981-08-24 | $129.23 | $128.59 | $128.59 | $125.02 | $125.50 | -2.89% |
| 1982-10-25 | $138.83 | $138.81 | $138.81 | $133.32 | $133.32 | -3.97% |
| 1986-07-07 | $251.79 | $251.79 | $251.81 | $243.63 | $244.05 | -3.07% |
| 1986-09-11 | $247.06 | $247.06 | $247.06 | $234.67 | $235.18 | -4.81% |
| 1987-10-14 | $314.52 | $314.52 | $314.52 | $304.78 | $305.23 | -2.95% |
| 1987-10-16 | $298.08 | $298.08 | $298.92 | $281.52 | $282.70 | -5.16% |
| 1987-10-19 | $282.70 | $282.70 | $282.70 | $224.83 | $224.84 | -20.47% |
| 1987-10-22 | $258.38 | $258.24 | $258.38 | $242.99 | $248.25 | -3.92% |
| 1987-10-26 | $248.22 | $248.20 | $248.22 | $227.26 | $227.67 | -8.28% |
| 1987-11-09 | $250.41 | $250.41 | $250.41 | $243.01 | $243.17 | -2.89% |
| 1987-11-30 | $240.34 | $240.27 | $240.34 | $225.75 | $230.30 | -4.18% |
| 1987-12-03 | $233.45 | $233.46 | $233.90 | $225.21 | $225.21 | -3.53% |
| 1988-01-08 | $261.07 | $261.05 | $261.07 | $242.95 | $243.40 | -6.77% |
| 1988-04-14 | $271.58 | $271.55 | $271.57 | $259.37 | $259.75 | -4.36% |
| 1989-10-13 | $355.39 | $355.39 | $355.53 | $332.81 | $333.65 | -6.12% |
| 1990-08-06 | $344.86 | $344.86 | $344.86 | $333.27 | $334.43 | -3.02% |
| 1990-08-23 | $316.55 | $316.55 | $316.55 | $306.56 | $307.06 | -3.00% |
| 1991-11-15 | $397.15 | $397.15 | $397.16 | $382.62 | $382.62 | -3.66% |
| 1996-03-08 | $653.65 | $653.65 | $653.65 | $627.63 | $633.50 | -3.08% |
| 1997-10-27 | $941.64 | $941.64 | $941.64 | $876.73 | $876.99 | -6.87% |
| 1998-01-09 | $956.05 | $956.05 | $956.05 | $921.72 | $927.69 | -2.97% |
| 1998-08-04 | $1,112.44 | $1,112.44 | $1,119.73 | $1,071.82 | $1,072.12 | -3.62% |
| 1998-08-27 | $1,084.19 | $1,084.19 | $1,084.19 | $1,037.61 | $1,042.59 | -3.84% |
| 1998-08-31 | $1,027.14 | $1,027.14 | $1,033.47 | $957.28 | $957.28 | -6.80% |
| 1998-09-30 | $1,049.02 | $1,049.02 | $1,049.02 | $1,015.73 | $1,017.01 | -3.05% |
| 1998-10-01 | $1,017.01 | $1,017.01 | $1,017.01 | $981.29 | $986.39 | -3.01% |
| 2000-01-04 | $1,455.22 | $1,455.22 | $1,455.22 | $1,397.43 | $1,399.42 | -3.83% |
| 2000-02-18 | $1,388.26 | $1,388.26 | $1,388.59 | $1,345.32 | $1,346.09 | -3.04% |
| 2000-04-14 | $1,440.51 | $1,440.51 | $1,440.51 | $1,339.40 | $1,356.56 | -5.83% |
| 2000-12-20 | $1,305.60 | $1,305.60 | $1,305.60 | $1,261.16 | $1,264.74 | -3.13% |
| 2001-03-12 | $1,233.42 | $1,233.42 | $1,233.42 | $1,176.78 | $1,180.16 | -4.32% |
| 2001-04-03 | $1,145.87 | $1,145.87 | $1,145.87 | $1,100.19 | $1,106.46 | -3.44% |
| 2001-09-17 | $1,092.54 | $1,092.54 | $1,092.54 | $1,037.46 | $1,038.77 | -4.92% |
| 2001-09-20 | $1,016.10 | $1,016.10 | $1,016.10 | $984.49 | $984.54 | -3.11% |
| 2002-01-29 | $1,133.06 | $1,133.06 | $1,137.47 | $1,098.74 | $1,100.64 | -2.86% |
| 2002-07-10 | $952.83 | $952.83 | $956.34 | $920.29 | $920.47 | -3.40% |
| 2002-07-19 | $881.56 | $881.56 | $881.56 | $842.07 | $847.75 | -3.84% |
| 2002-07-22 | $847.75 | $847.76 | $854.13 | $813.26 | $819.85 | -3.29% |
| 2002-08-01 | $911.62 | $911.62 | $911.62 | $882.48 | $884.66 | -2.96% |
| 2002-08-05 | $864.24 | $864.24 | $864.24 | $833.44 | $834.60 | -3.43% |
| 2002-09-03 | $916.07 | $916.07 | $916.07 | $877.51 | $878.02 | -4.15% |
| 2002-09-19 | $869.46 | $869.46 | $869.46 | $843.09 | $843.32 | -3.01% |
| 2002-09-27 | $854.95 | $854.95 | $854.95 | $826.84 | $827.37 | -3.23% |
| 2003-01-24 | $887.34 | $887.34 | $887.34 | $859.71 | $861.40 | -2.92% |
| 2003-03-24 | $895.79 | $895.79 | $895.79 | $862.02 | $864.23 | -3.52% |
| 2007-02-27 | $1,449.37 | $1,449.25 | $1,449.25 | $1,389.42 | $1,399.04 | -3.47% |
| 2007-08-09 | $1,497.49 | $1,497.21 | $1,497.21 | $1,453.09 | $1,453.09 | -2.96% |
| 2007-11-07 | $1,520.27 | $1,515.46 | $1,515.46 | $1,475.04 | $1,475.62 | -2.94% |
| 2008-01-17 | $1,373.20 | $1,374.79 | $1,377.72 | $1,330.67 | $1,333.25 | -2.91% |
| 2008-02-05 | $1,380.82 | $1,380.28 | $1,380.28 | $1,336.64 | $1,336.64 | -3.20% |
| 2008-06-06 | $1,404.05 | $1,400.06 | $1,400.06 | $1,359.90 | $1,360.68 | -3.09% |
| 2008-06-26 | $1,321.97 | $1,316.29 | $1,316.29 | $1,283.15 | $1,283.15 | -2.94% |
| 2008-09-04 | $1,274.98 | $1,271.80 | $1,271.80 | $1,232.83 | $1,236.83 | -2.99% |
| 2008-09-09 | $1,267.79 | $1,267.98 | $1,268.66 | $1,224.51 | $1,224.51 | -3.41% |
| 2008-09-15 | $1,251.70 | $1,250.92 | $1,250.92 | $1,192.70 | $1,192.70 | -4.71% |
| 2008-09-17 | $1,213.60 | $1,210.34 | $1,210.34 | $1,155.88 | $1,156.39 | -4.71% |
| 2008-09-22 | $1,255.08 | $1,255.37 | $1,255.37 | $1,205.61 | $1,207.09 | -3.82% |
| 2008-09-29 | $1,213.27 | $1,209.07 | $1,209.07 | $1,106.42 | $1,106.42 | -8.81% |
| 2008-10-02 | $1,161.06 | $1,160.64 | $1,160.64 | $1,111.43 | $1,114.28 | -4.03% |
| 2008-10-06 | $1,099.23 | $1,097.56 | $1,097.56 | $1,007.97 | $1,056.89 | -3.85% |
| 2008-10-07 | $1,056.89 | $1,057.60 | $1,072.91 | $996.23 | $996.23 | -5.74% |
| 2008-10-09 | $984.94 | $988.42 | $1,005.25 | $909.19 | $909.92 | -7.62% |
| 2008-10-15 | $998.01 | $994.60 | $994.60 | $903.99 | $907.84 | -9.03% |
| 2008-10-21 | $985.40 | $980.40 | $985.44 | $952.47 | $955.05 | -3.08% |
| 2008-10-22 | $955.05 | $951.67 | $951.67 | $875.81 | $896.78 | -6.10% |
| 2008-10-24 | $908.11 | $895.22 | $896.30 | $852.85 | $876.77 | -3.45% |
| 2008-10-27 | $876.77 | $874.28 | $893.78 | $846.75 | $848.92 | -3.18% |
| 2008-11-05 | $1,005.75 | $1,001.84 | $1,001.84 | $949.86 | $952.77 | -5.27% |
| 2008-11-06 | $952.77 | $952.40 | $952.40 | $899.73 | $904.88 | -5.03% |
| 2008-11-12 | $898.95 | $893.39 | $893.39 | $850.48 | $852.30 | -5.19% |
| 2008-11-14 | $911.29 | $904.36 | $916.88 | $869.88 | $873.29 | -4.17% |
| 2008-11-19 | $859.12 | $859.03 | $864.57 | $806.18 | $806.58 | -6.12% |
| 2008-11-20 | $806.58 | $805.87 | $820.52 | $747.78 | $752.44 | -6.71% |
| 2008-12-01 | $896.24 | $888.61 | $888.61 | $815.69 | $816.21 | -8.93% |
| 2008-12-04 | $870.74 | $869.75 | $875.60 | $833.60 | $845.22 | -2.93% |
| 2008-12-11 | $899.24 | $898.35 | $904.63 | $868.73 | $873.59 | -2.85% |
| 2009-01-07 | $934.70 | $927.45 | $927.45 | $902.37 | $906.65 | -3.00% |
| 2009-01-14 | $871.79 | $867.28 | $867.28 | $836.93 | $842.62 | -3.35% |
| 2009-01-20 | $850.12 | $849.64 | $849.64 | $804.47 | $805.22 | -5.28% |
| 2009-01-29 | $874.09 | $868.89 | $868.89 | $844.15 | $845.14 | -3.31% |
| 2009-02-10 | $869.89 | $866.87 | $868.05 | $822.99 | $827.16 | -4.91% |
| 2009-02-17 | $826.84 | $818.61 | $818.61 | $789.17 | $789.17 | -4.56% |
| 2009-02-23 | $770.05 | $773.25 | $777.85 | $742.37 | $743.33 | -3.47% |
| 2009-03-02 | $735.09 | $729.57 | $729.57 | $699.70 | $700.82 | -4.66% |
| 2009-03-05 | $712.87 | $708.27 | $708.27 | $677.93 | $682.55 | -4.25% |
| 2009-03-30 | $815.94 | $809.07 | $809.07 | $779.81 | $787.53 | -3.48% |
| 2009-04-20 | $869.60 | $868.27 | $868.27 | $832.39 | $832.39 | -4.28% |
| 2009-06-22 | $921.23 | $918.13 | $918.13 | $893.04 | $893.04 | -3.06% |
| 2009-07-02 | $923.33 | $921.24 | $921.24 | $896.42 | $896.42 | -2.91% |
| 2010-02-04 | $1,097.28 | $1,097.25 | $1,097.25 | $1,062.78 | $1,063.11 | -3.11% |
| 2010-05-06 | $1,165.87 | $1,164.38 | $1,167.58 | $1,065.79 | $1,128.15 | -3.24% |
| 2010-05-20 | $1,115.05 | $1,107.34 | $1,107.34 | $1,071.58 | $1,071.59 | -3.90% |
| 2010-06-04 | $1,102.83 | $1,098.43 | $1,098.43 | $1,060.50 | $1,064.88 | -3.44% |
| 2010-06-29 | $1,074.57 | $1,071.10 | $1,071.10 | $1,035.18 | $1,041.24 | -3.10% |
| 2010-07-16 | $1,096.48 | $1,093.85 | $1,093.85 | $1,063.32 | $1,064.88 | -2.88% |
| 2011-08-04 | $1,260.34 | $1,260.23 | $1,260.23 | $1,199.54 | $1,200.07 | -4.78% |
| 2011-08-08 | $1,199.38 | $1,198.48 | $1,198.48 | $1,119.28 | $1,119.46 | -6.66% |
| 2011-08-10 | $1,172.53 | $1,171.77 | $1,171.77 | $1,118.01 | $1,120.76 | -4.42% |
| 2011-08-18 | $1,193.89 | $1,189.62 | $1,189.62 | $1,131.03 | $1,140.65 | -4.46% |
| 2011-09-21 | $1,202.09 | $1,203.63 | $1,206.30 | $1,166.21 | $1,166.76 | -2.94% |
| 2011-09-22 | $1,166.76 | $1,164.55 | $1,164.55 | $1,114.22 | $1,129.56 | -3.19% |
| 2011-11-09 | $1,275.92 | $1,275.18 | $1,275.18 | $1,226.64 | $1,229.10 | -3.67% |
| 2015-08-21 | $2,035.73 | $2,034.08 | $2,034.08 | $1,970.89 | $1,970.89 | -3.19% |
| 2015-08-24 | $1,970.89 | $1,965.15 | $1,965.15 | $1,867.01 | $1,893.21 | -3.94% |
| 2015-09-01 | $1,972.18 | $1,970.09 | $1,970.09 | $1,903.07 | $1,913.85 | -2.96% |
| 2016-06-24 | $2,113.32 | $2,103.81 | $2,103.81 | $2,032.57 | $2,037.41 | -3.59% |
| 2018-02-05 | $2,762.13 | $2,741.06 | $2,763.39 | $2,638.17 | $2,648.94 | -4.10% |
| 2018-02-08 | $2,681.66 | $2,685.01 | $2,685.27 | $2,580.56 | $2,581.00 | -3.75% |
| 2018-10-10 | $2,880.34 | $2,873.90 | $2,874.02 | $2,784.86 | $2,785.68 | -3.29% |
| 2018-10-24 | $2,740.69 | $2,737.87 | $2,742.59 | $2,651.89 | $2,656.10 | -3.09% |
| 2018-12-04 | $2,790.37 | $2,782.43 | $2,785.93 | $2,697.18 | $2,700.06 | -3.24% |
| 2019-08-05 | $2,932.05 | $2,898.07 | $2,898.07 | $2,822.12 | $2,844.74 | -2.98% |
The nearly 3% drop in the S&P 500's value on Monday, 5 August 2019 pales in comparison to the worst ever single day decline of 20.47% that was recorded back on Monday, 19 October 1987, which earned that day the title of "Black Monday", the single worst day ever recorded in U.S. stock market history.
Note that many of these relatively rare large one-day declines have tended to be clustered together in time. Whether that happens now in 2019 will depend on the flow of new information that might cause investors to shift their attention to other points of time in the future, where an additional 3% drop from its current level would coincide with investors shifting their attention to the current quarter of 2019-Q3. And as you can see from our first chart, any news that might fix the attention of investors on 2020-Q2 would coincide with a much, much larger crash in stock prices.
That assumes, of course, that there is no erosion in the expectations in the S&P 500's dividends per share at these future points of time, which would amplify the indicated potential declines.
Labels: SP 500, volatility
Welcome to the blogosphere's toolchest! Here, unlike other blogs dedicated to analyzing current events, we create easy-to-use, simple tools to do the math related to them so you can get in on the action too! If you would like to learn more about these tools, or if you would like to contribute ideas to develop for this blog, please e-mail us at:
ironman at politicalcalculations
Thanks in advance!
Closing values for previous trading day.
This site is primarily powered by:

CSS Validation

RSS Site Feed

JavaScript
The tools on this site are built using JavaScript. If you would like to learn more, one of the best free resources on the web is available at W3Schools.com.
Other Cool Resources
Blog Roll


