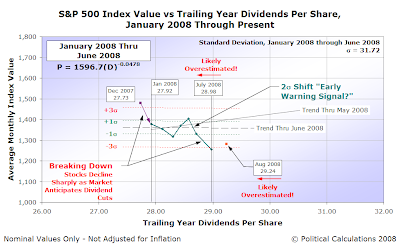
The S&P 500 has resumed moving sideways after dropping out of the range of equilibrium the market established beginning in January 2008. The following chart shows where the stock market stands as of the end of August 2008:

At this time, we would anticipate that the market will generally trend along the line indicated by the -3&sigma "lower control limit" that was established in the first six months of 2008, with a slight upward bias provided that oil prices, to which the market has proved sensitive, continue to steadily decline.
For the record, the lines representing the control limits on the chart above no longer have much meaning following July 2008's busting out of them. They're simply there as a frame of reference!
As always, the main mover of the relative valuation of stocks with respect to their dividends is investor expectations of future level of the companies' "sustainable" earnings, which is represented by their dividends. The sideways movement we're observing now confirms that much remains unsettled, especially in the financial and banking sectors of the S&P 500. We anticipate this sideways movement to largely continue until investors absorb whatever information these companies provide about their future level of earnings as we end the third quarter of 2008 this month and enter the fourth quarter in October.
Yeah, we know. Writing a summary of market performance this year is a lot like writing horoscopes!...
Labels: SP 500, stock market
Welcome to the blogosphere's toolchest! Here, unlike other blogs dedicated to analyzing current events, we create easy-to-use, simple tools to do the math related to them so you can get in on the action too! If you would like to learn more about these tools, or if you would like to contribute ideas to develop for this blog, please e-mail us at:
ironman at politicalcalculations
Thanks in advance!
Closing values for previous trading day.
This site is primarily powered by:
CSS Validation
RSS Site Feed
JavaScript
The tools on this site are built using JavaScript. If you would like to learn more, one of the best free resources on the web is available at W3Schools.com.