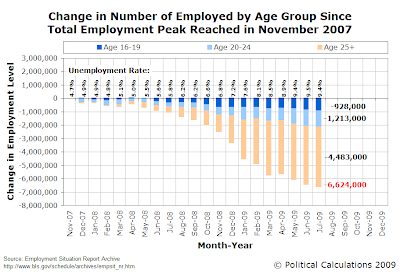
In the chart above, we've added data to indicate the official unemployment rate for the U.S. for each month since the current recession began. Remarkably, even though the official unemployment rate for the U.S. civilian workforce sits at 9.4% in July 2009, the same as for May 2009, well over half a million jobs have disappeared in the two months that have elapsed. July's reduction in the level of total employment in the U.S. since November 2007 is 6,624,000, while in May 2009, that figure was 6,095,000, the difference being 529,000.
Those figures confirm that the number of people either employed or actively seeking work in the civilian labor force has declined substantially over the past two months. Mathematically, the only way the unemployment rate can remain stable when an increased number of jobs are being lost in the economy is for a large portion of individuals without jobs to stop actively seeking work.
We can confirm this by looking at the change in the number of individuals counted as not being part of the labor force. Here, we find that between May 2009 and July 2009, the number of those counted as not being in the U.S. labor force (those neither employed nor seeking work) jumped by nearly one million individuals, from 80,371,000 to 81,366,000. The average increase in the number of individuals counted as not being part of the U.S. workforce between the months of May and July for the years running from 1999 through 2008 is 272,000.

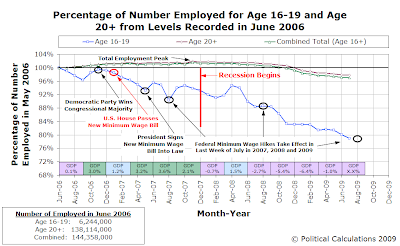
That's especially remarkable given that a third of that job loss occurred before the current U.S. recession began in December 2007, at a time when the U.S. economy was steadily growing at a healthy pace. Recently revised real GDP growth data reveals that economic growth was positive throughout 2007, with real GDP rising at rates of 1.2%, 3.2%, 3.6% and 2.1% for each of the year's quarters.
However, teen employment levels plunged, even as total employment levels increased up until November 2007.
But then, the reason why really isn't much of a mystery!
More Data
The employment data we've presented in this post is taken from the BLS' Labor Force Statistics, which is derived from the U.S. Census' Current Population Survey.
Elsewhere
The Wall Street Journal features an article on the plight of the unskilled teenage job hunter, who's finding tough competition for today's dwindling supply of higher minimum wage-earning jobs from people who offer more productivity for the money to their economically-distressed employers.
Labels: jobs, minimum wage
Welcome to the blogosphere's toolchest! Here, unlike other blogs dedicated to analyzing current events, we create easy-to-use, simple tools to do the math related to them so you can get in on the action too! If you would like to learn more about these tools, or if you would like to contribute ideas to develop for this blog, please e-mail us at:
ironman at politicalcalculations
Thanks in advance!
Closing values for previous trading day.
This site is primarily powered by:
CSS Validation
RSS Site Feed
JavaScript
The tools on this site are built using JavaScript. If you would like to learn more, one of the best free resources on the web is available at W3Schools.com.