 After peeking into August 2009 through our crystal ball just a week ago, it would seem that the U.S stock market may be headed for a slightly better month than we had anticipated. Applying the dividend futures data in effect as of this morning to our basic math, we would project the average of the S&P 500 for the month of August 2009 to range between 1005 and 1020. Our currently anticipated range is based on the following data:
- The S&P 500's average daily closing value of 1281.47 for the month of August 2008.
- The compound annualized rate of change of the average daily closing value between the months of July 2008 and July 2009 of -25.6%.
- The change in the expected rate of growth of trailing year dividends per share for the end of this year of 0.071. With the dividend futures contract for December 2009 expiring on 20 December 2009, this figure is based on the currently expected change from the futures represented by that contract to the one that expires on 20 March 2010. In other words, investors are currently projecting the value of stock prices by considering where they expect the market's dividends per share will be approximately 5 months from now.
- The typical amplification factors that we've observed for the S&P 500 for the period since January 2001, which we apply to the expected change in the growth rate of dividends per share to produce our estimate of the expected change in the rate of growth of stock prices for the month of August 2009, from which we project our range of stock prices. While those values have generally ranged from 7.0 to 11.0 during that time, the limits of the range we've indicated are based on an amplification factor of 7.0 for the low end (1007) and 9.0 for the upper end (1022). An amplification factor of 11.0 would place the level of the S&P 500 as high as 1037. Since we've observed a slow erosion in the change in the rate of growth of dividends per share throughout this year, we obtained our actual prediction range of 1005 to 1020 by rounding these values downward to the nearest multiple of five.
The main driving factor behind the current rise in stock prices continues to be investor expectations that things are becoming worse much more slowly than earlier this year. That expectation has largely produced the positive acceleration that has driven stock prices upward since the market bottomed on 9 March 2009. Here's an illustration of that in effect, first looking at how expected trailing year dividends per share have slowly eroded since March 2009:

|

|

|
|---|
These charts demonstrate that the level of expected trailing year dividends per share for the S&P 500 has generally fallen throughout the period in which we've seen the market rally (note the relative position of the bars with respect to the horizontal red line.) However, if we look at the expected change in the rate of growth of dividends per share for the S&P 500, we see that by shifting this data five months toward the future and applying our amplification factors, we can match the rate of change that we have observed for the rate of growth of the value of the S&P 500 index since the market bottomed in early March:

|

|
|---|
There are four potential factors that might result in stock prices deviating from our projections:
- Changes in the expected future level of dividends per share. As we've noted, we've observed a steady, but slowing fall in the level of expected trailing year dividends per share throughout this year, which has been paced by corporate announcements either confirming or changing their dividend payment plans. As we approach the end of the year, we would anticipate that companies may alter those existing plans as their business conditions may have changed significantly since they originally set them in place. The cumulative effect of all these kinds of changes from the hundreds of companies that make up the S&P 500 composite index results in changing where we would expect stock prices to go based upon their future dividend payments. To use a high school track metaphor, imagine a finish line that is constantly shifting position.
 A shift in investor focus to a different point of time in the future. We documented this kind of change in March 2009, as investors shifted from a focus on the first quarter of 2009 to the first quarter of 2010, which coincided with the bottoming of stock prices at that time. This change occurred as the quarterly earnings reporting cycle for 2009Q1 ended, which many companies used to revise their expected dividend payments downward. With the vast majority of bad news out, investors refocused on expectations for the end of the year. Using our track metaphor, the finish line can move significantly. And suddenly.
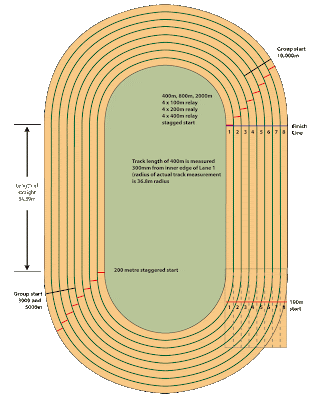
- Basejumping. No, we don't mean that investors will take up parachuting from bridges or tall buildings. Instead, we're referring to investors changing the base reference point from which they would appear to project the current value of stock prices. We normally use a point one year in the past as our base reference, but as we found earlier, that doesn't necessarily stay constant. The best way to think of this effect is to think about running on a high school track. Imagine you've begun running in one of the marked lanes from one of the staggered starting positions marked on the track. Then, without warning, you find yourself in another lane, with a different starting position, which in turn affects where the finish line is.
- Noise. This is a catch-all category that applies when nothing else can be identified to explain a change in the level of stock prices. Noise tends to be random and therefore, unpredictable, but not always. Noise is always present to some degree, and if unaccompanied by corresponding changes in dividends per share, often represents an investing opportunity, whether buying or selling. In our math, the effect of noise mainly affects the amplification factor and, for the sake of our high school track metaphor, is like hitting a freak headwind or catching an equally freaky tailwind. The effects of noise always eventually subside.

Our final chart illustrates the path that stock prices have taken with respect to trailing year dividends per share since December 1991, with our full month projections indicated since April 2009, when we began making such projections:

Labels: chaos, forecasting, SP 500
Welcome to the blogosphere's toolchest! Here, unlike other blogs dedicated to analyzing current events, we create easy-to-use, simple tools to do the math related to them so you can get in on the action too! If you would like to learn more about these tools, or if you would like to contribute ideas to develop for this blog, please e-mail us at:
ironman at politicalcalculations
Thanks in advance!
Closing values for previous trading day.
This site is primarily powered by:
CSS Validation

RSS Site Feed
JavaScript
The tools on this site are built using JavaScript. If you would like to learn more, one of the best free resources on the web is available at W3Schools.com.
Other Cool Resources
Blog Roll


