Political Calculations
March 25, 2011
Map of Violent Crime Rates Across Canada - Source: Wikipedia
Violent Crime Rates Across Canada
Source: Wikipedia

Yesterday, we suggested that Canada's apparent reduction of 1 homicide victim per 100,000 people that might be attributed to Canada's more restrictive gun control laws as compared to the United States was perhaps overstated.

The reason why that may be the case is because Canadian homicide offenders, who are less able to acquire firearms than U.S. homicide offenders, instead substitute the homicide methods of stabbing and beating in committing their murders.

Unlike shooting, these methods of murder require far more physical energy and time on the part of the offenders to kill their victims. So much so that it is more likely that the victims of these kinds of assaults might be able to survive the effort to kill them than a shooting victim is able to survive being shot.

One consequence of this greater difficulty for offenders to kill their victims through these kinds of violent assaults is that Canadian homicide statistics will not fully reflect how close some of the victims who survived being assaulted this way may have come to actually being killed.

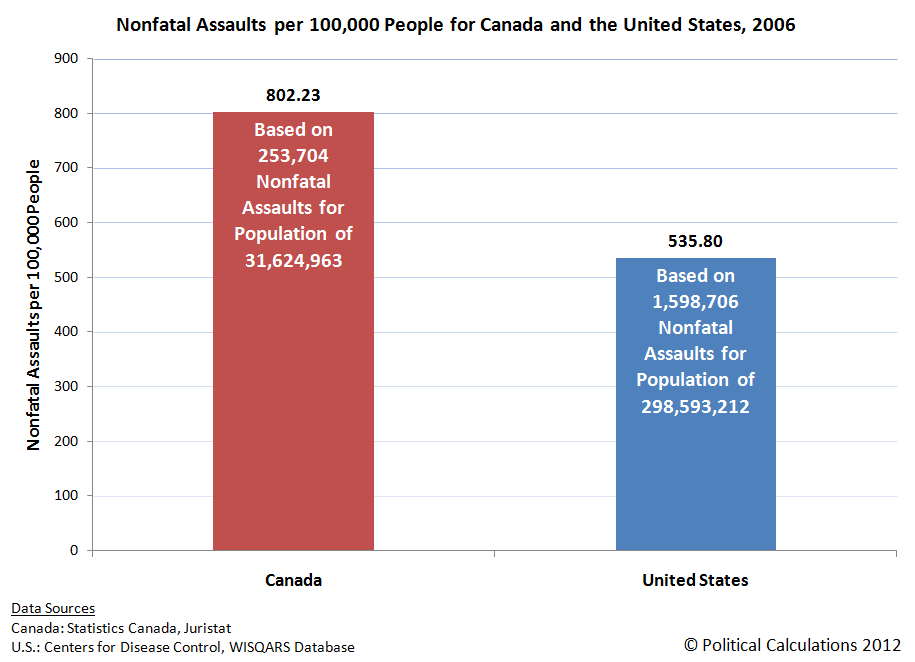
To get a better sense of that factor, we returned to Canadian crime statistics and the U.S. WISQARS non-fatal injury database to compare each nation's relative levels of nonsexual and nonfatal assaults. The raw numbers we found for both nations are presented in our first chart.

Update 31 December 2012: We've corrected the numbers in the chart below, which previously only showed the combined total of Level 2 and Level 3 assaults in Canada, but all nonfatal, nonsexual assaults in the United States - the corrected version below shows the correct total for all nonfatal, nonsexual assaults in Canada in 2006. We've edited the remaining text and charts in the post to correspond to the corrected total assault numbers for Canada.

Nonfatal Assaults for Canada and the United States, 2006

We next calculated the nonfatal assault rate per each 100,000 people for each country's entire population.

Update 31 December 2012: The original version is here, which was based on Canada's total nonfatal, nonsexual assault totals with a different estimate of Canada's population.

Nonfatal, Nonsexual Assaults per 100,000 People for Canada and the United States, 2006

Since the WISQARS nonfatal injury data cannot be broken down by U.S. racial and ethnicity classifications as the database's fatal injury data can, this is as far as we can take the analysis. However, it is far enough to draw the conclusion that Canadians are assaulted at far higher rates than are Americans.

Overall, in 2006, there were 56,706 253,704 nonsexual assaults in Canada, or 770.23 802.23 per each 100,000 Canadians. In the U.S., there were 1,598,706 nonsexual assaults, or 535.41 per each 100,000 Americans. That's a nearly 235 266 for each 100,000 inhabitant difference between the two countries. That's a difference that would likely be even greater if we could drill down to count the number of assaults for the portion of the U.S. population that is most demographically similar to the Canadian population.

The only question then is what fraction of this much higher level of violent assault might account for victims being effectively "left for dead," but who instead manage to survive from the injuries inflicted upon them by their assailants?

We'll observe that it would only take 1 out of those 770 802 assaults per 100,000 Canadians to qualify as being that severe to fully make up the difference between Canadian and U.S. homicide rates per 100,000 inhabitants, at least among the portion of the U.S. population most demographically similar to Canada's population.

That very small fraction then suggests that Canada's gun control restrictions provide very little benefit to Canada's citizens. And if firearm possession should turn out to be a deterrent to physical assaults, Canadians may indeed be considerably worse off.

Image Credit: Wikipedia.

Data Sources

Juristat. Canadian Centre for Justice Statistics. Statistics Canada - Catalogue No. 85-002, Vol. 28, No. 7. Crime Statistics in Canada, 2007. Table 2. Selected Criminal Code Incidents, by most serious offence, Canada, 2006 and 2007. Accessed 23 March 2011.

U.S. Centers for Disease Control. WISQARS Nonfatal Injury Reports. Accessed 23 March 2011.

Labels: ,


<< Home
Unexpectedly Intriguing!

About Political Calculations


blog advertising
is good for you

Welcome to the blogosphere's toolchest! Here, unlike other blogs dedicated to analyzing current events, we create easy-to-use, simple tools to do the math related to them so you can get in on the action too! If you would like to learn more about these tools, or if you would like to contribute ideas to develop for this blog, please e-mail us at:

ironman at politicalcalculations.com

Thanks in advance!

Recent Posts

U.S. vs Canada: Homicide Modi Operandi

U.S. vs Canada: Homicide Edition

U.S. vs Canada: Comparing Apples to Apples

U.S. vs Canada: Comparing Oranges and Apples

Markets in Everything: Brainy CFLs

The Elephant in the Room

Rising and Fading World Powers

To Whom Does the U.S. Government Really Owe Money?...

Repaving The Sidewalk to Nowhere

Adjusted Forecast for the S&P in March 2011

Most Popular Posts

The S&P 500 at Your Fingertips

The Distribution of Income for 2010: Individuals

Should You Trade in Your Gas Guzzler?

What Are the Chances Your Marriage Will Last?

Tipping Around the World

What's Your Body Fat Percentage?

The Odds of Dying, Again!

Gas Prices, the Unemployment Rate, and Desperation

Hauser's Law

The Real Story Behind "Rising" U.S. Income Inequality

Quick Index

First Time Visitor to Political Calculations?

On the Moneyed Midways

A Lot, But Not All, of Our Tools

U.S. GDP Temperature Gauge

Political Calculations' GDP Temperature Gauge, 2013Q1 First Estimate Political Calculations' U.S. GDP Temperature Gauge provides a means to quickly evaluate the growth rate of the U.S. economy against the backdrop of how the economy has performed since 1980, with the "temperature" color spectrum ranging from a recessionary "cold" (purple) through an expansionary "hot" (red).

The GDP Temperature Gauge presents both the annualized GDP growth rate as reported by the U.S. Bureau of Economic Analysis reports for a one-quarter period and also as averaged over a two quarter period, which smooths out the volatility seen in the one-quarter data and provides a better indication of the relative strength of the U.S. economy over time.

Site Data

This site is primarily powered by:

This page is powered by Blogger. Isn't yours?

Visitors since December 6, 2004:

CSS Validation

Valid CSS!

RSS Site Feed

AddThis Feed Button

JavaScript

The tools on this site are built using JavaScript. If you would like to learn more, one of the best free resources on the web is available at W3Schools.com.

Other Cool Resources

ZunZun - Exceptional regression analysis tool.
Wolfram Integrator - Solve integrals. Do calculus!
Create a Graph - Easy-to-use basic graph-making tool.
Many Eyes - Data visualization extraordinaire!
Wolfram Alpha - Computational knowledge engine.
Khan Academy - Math & science video mini-lectures!
Picasion - Animate images.


Archives
December 2004
January 2005
February 2005
March 2005
April 2005
May 2005
June 2005
July 2005
August 2005
September 2005
October 2005
November 2005
December 2005
January 2006
February 2006
March 2006
April 2006
May 2006
June 2006
July 2006
August 2006
September 2006
October 2006
November 2006
December 2006
January 2007
February 2007
March 2007
April 2007
May 2007
June 2007
July 2007
August 2007
September 2007
October 2007
November 2007
December 2007
January 2008
February 2008
March 2008
April 2008
May 2008
June 2008
July 2008
August 2008
September 2008
October 2008
November 2008
December 2008
January 2009
February 2009
March 2009
April 2009
May 2009
June 2009
July 2009
August 2009
September 2009
October 2009
November 2009
December 2009
January 2010
February 2010
March 2010
April 2010
May 2010
June 2010
July 2010
August 2010
September 2010
October 2010
November 2010
December 2010
January 2011
February 2011
March 2011
April 2011
May 2011
June 2011
July 2011
August 2011
September 2011
October 2011
November 2011
December 2011
January 2012
February 2012
March 2012
April 2012
May 2012
June 2012
July 2012
August 2012
September 2012
October 2012
November 2012
December 2012
January 2013
February 2013
March 2013
April 2013
May 2013

Blog Roll

Bloodhoundblog
Budgets Are Sexy
Cafe Hayek
Carpe Diem
Core77
Coyote Blog
Craig Harper
Darwin's Finance
Digerati Life, The
Division of Labour
Dough Roller, The
Eclectecon
Econlog
Economics Roundtable
EconomicsUK
Environmental Economics
Escape from Cubicle Nation
Execupundit
FiscalGeek
Get Rich Slowly
Gongol
Good Financial Cents
HR Bartender
Hot Air
i4cp Productivity
Innocent Bystanders
Innovation and Growth
Instapundit
Intangible Economy
I've Paid Twice for This Already
Joanne Jacobs
Kaus Files
Len Penzo dot Com
Making Ripples
Market Power
Mechonomics
Mighty Bargain Hunter
Monevator
My Dollar Plan
New Economist
Newmark's Door
Nina Simosko
Physorg
Private Sector Development
Real Clear Politics
Richard Fernandez
Roger L. Simon
Rowan Manahan
Sound Politics
SOX First
Sports Economist, The
squawkfox
Three Star Leadership
Tim Worstall
Townhall
Trusted Advisor
Uncommon Misperceptions
voluntaryXchange
WILLisms
Winterspeak

Market Links

Big Picture, The
Crackerjack Finance
CXO Advisory Group
Disciplined Approach to Investing
Dividend Guy, The
Doug Short
Evidence Investing
Fat Pitch Financials
FX Investment Strategies
Oilprice

Charities We Support

American Red Cross
Children's Heart Foundation
Salvation Army
SMA Foundation

Recommended Reading

Kindle Paperwhite 3G - Best e-reader!
Angel in the Whirlwind
Bailout Nation
Cartoon Guide to Statistics
A Comprehensive Guide to the Peloponnesian War
The Complete Personal Memoirs of Ulysses S. Grant
The Count of Monte Cristo
Ender's Game
Gardner's Art Through the Ages
Empire of Wealth
How to Make Presentations to Councils and Boards
Juran's Quality Handbook
Marks' Standard Handbook
The Second World War
Stocks for the Long Run
Why Smart Executives Fail

Recommended Viewing

The Tudors: The Complete Series

Recently Shopped

Kindle Fire HD 8.9" 4G LTE Wireless 32 GB
Snap Circuits Jr. SC-100
Nerf Vortex Praxis
Sony BRAVIA 40" LED HDTV
2540 Series Docking Station
New Balance MX623
Dunham Men's Waterproof Oxford
TN360 Black Toner Cartridge
The Dangerous Book for Boys
Air Swimmer Remote Control Inflatable Flying Shark
Fisher-Price Little People Lil Pirate Ship

Seeking Alpha Certified