
As econoblog readers, we follow Econbrowser pretty regularly, mainly for Jim Hamilton's insights, but recently, we've begun paying closer attention to the comments of his co-blogger, Menzie Chinn, who is an economics professor at the University of Wisconsin-Madison.
That's primarily because of the recent rise to prominence of Wisconsin state governor Scott Walker in 2016 presidential polling, whose performance in office Chinn has often criticized. Normally, we're entertained by Chinn's analysis, since it frequently involves comparisons of the job growth between Wisconsin and its western neighbor Minnesota since Walker was sworn into office in January 2011, which we find funny because of all the states surrounding Wisconsin, the composition of Wisconsin's economy is much less similar to Minnesota than it is to any of the states with which the state shares waterfront footage on Lake Michigan, which is something that one might think an economics professor at the University of Wisconsin-Madison would know.
Recently, Chinn has commented on two issues facing Wisconsin that are connected to each other: the state's reduction in tax collections following the implementation of Governor Walker's tax cuts in 2014 and also the Governor's proposed cuts in state funding supporting the University of Wisconsin, which follows from the state's reduced tax revenues.
Let's look first at Wisconsin's tax collections. Our first chart shows the rolling four quarter total we calculated for the state's tax collections as reported by the U.S. Census Bureau from 1995 through the end of the third quarter of 2014, which at this writing, is the most recent data available. We've annoted the chart to indicate periods of recession (the shaded vertical red bands) and also who was serving as the state's governor (in black text) and also the timing of when the state implemented major changes in its tax policies (in red text).

As you might expect, we see that recessions are bad for tax collections, that tax collections tend to rise following tax rate hikes and tend to fall after tax rate cuts are implemented.
But changes in tax rates affect more than just state tax collections. They can also impact the relative performance of the state's economy, which can affect the growth rate of its GDP and its level of employment. Our next chart looks at the raw numbers for Wisconsin's state GDP through the fourth quarter of 2013 (the most recent data available from the U.S. Bureau of Economic Analysis).

Our next chart repeats that exercise for the trailing twelve month average of Wisconsin's total employment level for each quarter from 1995 through 2014 as reported by the U.S. Bureau of Labor Statistics.
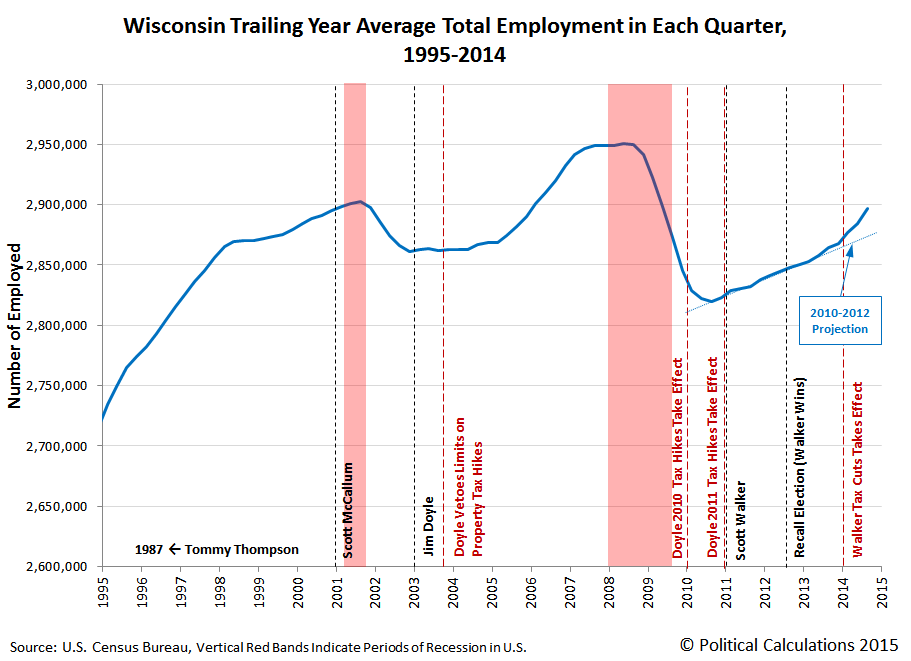
In the employment chart, we've also indicated the trajectory that employment levels in Wisconsin was following after bottoming during the recession, for the period from 2010 through 2012.
One of the more interesting observations that Professor Chinn has provided is that Wisconsin's employment levels have lagged those of both the U.S. and Minnesota during the first years of Governor Walker's first term in office. Chinn however neglects to mention in his comments that Governor Walker faced extreme political opposition to his actions to resolve a massive budget deficit that he inherited from the state's previous governor, Jim Doyle.
Here, Doyle had imposed $2.2 billion of new taxes in his 2009-2011 biennial state budget, with $1.1 billion of that hitting in 2010 and the remaining $1.1 billion increase hitting taxpayers in 2011. A good portion of these taxes was expected to be used to sustain the increased spending benefiting Doyle's political supporters employed in the state's various government agencies and other institutions, such as the University of Wisconsin, which were set to receive a massive, but temporary inflow of funds from President Obama's 2009 economic stimulus program.
That extreme opposition even extended to a number of state senators representing the state's Democratic party, who fled the state rather than to allow votes on measures to restore fiscal balance to the state's government, which effectively shut down the state's legislature and preventing Governor Walker from implementing pro-economic growth measures.
After they did return and Walker was successful in breaking the power of the state's public employee unions, whose interests were being represented by the state senators who acted to flee the state rather than fulfill their responsibilities as elected legislators, they retaliated by forcing a recall election. Combined with the recall of a number of state senators in Walker's political party during the summer of 2011, the combination was enough to block Walker from being able to implement a significant portion of his pro-growth economic agenda during the period covered by Wisconsin's 2011-2013 biennial budget.
Until, that is, after the gubernatorial recall election in June 2012, which Governor Walker won. Following that victory, Walker began to make measurable progress in implementing his long-delayed economic reforms, with both economic growth rates and employment levels picking up considerably after June 2013, which is when Wisconsin's next biennial budget shaped according to Governor Walker's priorities went into effect.
You can see that happen in our next chart showing how the state's year-over-year GDP and employment growth rates have evolved since 1995.

Note that the trend for the state's economic growth tends to precede the trend for the state's employment growth. Note also that the long delay in improvement in the state's GDP and employment levels after Governor Walker's election were a direct consequence of the perverse success that the political opposition to Governor Walker had in obstructing the implementation of the Governor's pro-growth policies, where the interests of public employee unions and other left-wing interests were put ahead of those of regular Wisconsinites.
Now that we've established that the implementation of Governor Walker's preferred economic policies was greatly delayed as a result of the political shenanigans of his opposition, let's look next at a key measure of how the state's tax policies affect its most productive citizens - the average amount of taxes collected per employed Wisconsinite:

This chart confirms that Governor Walker's tax cuts, when adjusted to account for the effect of inflation, have only returned to the level they were during most of the term of the preceding governor, Jim Doyle. Or rather, the part of Governor Doyle's term before he succeeded in imposing that dramatic $2.2 billion worth of tax hikes in 2010 and 2011.
As we noted before, much of the money collected through those new, higher taxes went to benefit Governor Doyle's political supporters employed at various government agencies and at state-funded institutions, such as the University of Wisconsin-Madison, so we'll close on an interesting footnote.
In Fall 2009, the University of Wisconsin-Madison employed 2,017 faculty and 16,507 administrative staff. In Fall 2010, funded in part by Governor Doyle's new taxes and benefiting from President Obama's economic "stimulus", the number of faculty members increased by 10 to 2,027, while the number of administrative staff increased by 836 to 17,343. Since Fall 2011, of the 19,527 faculty, grad students and staff reported as being employed at the University of Wisconsin-Madison, where 2,200 are faculty and another 2,000 or so are grad student/teaching assistants, we can infer that the size of the university's administrative staff has increased to around 17,527, which represents an approximate 1,020 increase in the number of administrative staff since Fall 2009.
Coincidentally, Professor Chinn reports that the University of Wisconsin-Madison's Chancellor Becky Blanks has said that the Governor's proposed reduction in funding for the institution could require it to shed some 1,083 staff positions.
Well, that would be about right, wouldn't it? Just thought we'd take a quick moment to connect the appropriate dots....
Labels: business, economics, education, politics, taxes
Welcome to the blogosphere's toolchest! Here, unlike other blogs dedicated to analyzing current events, we create easy-to-use, simple tools to do the math related to them so you can get in on the action too! If you would like to learn more about these tools, or if you would like to contribute ideas to develop for this blog, please e-mail us at:
ironman at politicalcalculations
Thanks in advance!
Closing values for previous trading day.
This site is primarily powered by:
CSS Validation

RSS Site Feed
JavaScript
The tools on this site are built using JavaScript. If you would like to learn more, one of the best free resources on the web is available at W3Schools.com.
Other Cool Resources
Blog Roll


