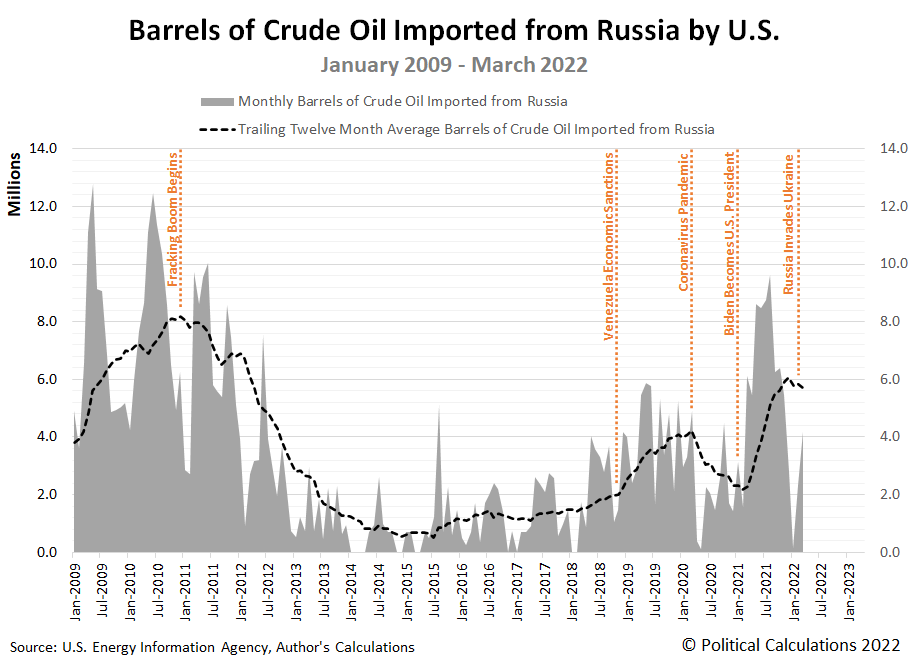
From time to time, we take on the challenge of telling a complex story through a picture. The story of the crude oil imported by the United States from Russia is just that kind of story because of all the economics and geopolitics involved.
Here's the picture, spanning the years from January 2009 through March 2022, in which we see U.S. imports of Russian crude oil rise and fall multiple times, each driven by different factors.
Here's the information the chart is expressing:
- November 2018
-
- Executive Order 13850 of November 1 2018 Blocking Property of Additional Persons Contributing to the Situation in Venezuela
- The sanctions on Venezuelan officials would soon be expanded to include a prohibition on the import of crude oil from the South American nation at the end of January 2019. U.S. oil importers read the tea leaves however and began switching to Russian-produced crude oil with the introduction of this earlier set of sanctions. Russia would rise to become the U.S.' second largest foreign source of crude oil within two years.
-
- December 2019
-
- A Decade in Which Fracking Rocked the Oil World
- U.S.-produced crude oil began displacing Russian crude oil imports in the U.S. from January 2011, rising on the fracking boom that continued all the way up to the coronavirus pandemic in 2020, which crashed oil prices and crippled the domestic industry. It still hasn't recovered, but we'll touch on that story again in this timeline.
From here, we'll let the headlines tell the most recent part of the story, which will begin from top of the latest peak in the U.S.' crude oil imports from Russia. Spoiler alert: they involve lots of new sanctions and actions that have contributed to today's much higher oil prices.
- August 2021
- September 2021
- December 2021
- January 2022
- February 2022
- March 2022
That ends the period covered on the chart, with Russian crude oil imports falling once again. But before any Biden administration official might celebrate the apparent success of their anti-Russia sanctions, there are two more breaking news stories that explains why they've so far failed to achieve the success they hoped for.
- Russia is on track to make more money off oil and gas exports this year than it did in 2021, and it's got the EU to thank.
- A fracking boom made the US the world's biggest oil producer. Now its end is pushing gas prices much higher.
In addressing domestic oil production, the Biden administration isn't as powerless as it makes itself out to be. It can take positive steps to boost and stabilize domestic oil production, such as lifting regulatory burdens and underwriting and insuring new investments to minimize the economic risks for producers that haven't recovered from the coronavirus pandemic crash. A good question to ask is why aren't they?
References
U.S. Energy Information Administration. U.S. Imports from Russia of Crude Oil. [Online Database]. Accessed 11 June 2022.
U.S. Energy Information Administration. U.S. Crude Oil Production. [Online Database]. Accessed 11 June 2022.
Labels: data visualization
Welcome to the blogosphere's toolchest! Here, unlike other blogs dedicated to analyzing current events, we create easy-to-use, simple tools to do the math related to them so you can get in on the action too! If you would like to learn more about these tools, or if you would like to contribute ideas to develop for this blog, please e-mail us at:
ironman at politicalcalculations
Thanks in advance!
Closing values for previous trading day.
This site is primarily powered by:
CSS Validation
RSS Site Feed
JavaScript
The tools on this site are built using JavaScript. If you would like to learn more, one of the best free resources on the web is available at W3Schools.com.
