
At long last, the Federal Reserve is on the verge of resuming rate cuts.
The Federal Reserve last cut the Federal Funds Rate to its current target level of 4.25-4.50% in December 2024. When it did, it lowered the probability of recession predicted by the recession forecasting method we've been tracking to its lowest level since early 2023.
But it never dropped below the 20% threshold. Currently, the recession probability method developed by Jonathan Wright while working for the Federal Reserve Board back in 2006 indicates the U.S. economy has a 26.5% chance the National Bureau of Economic Research will someday determine a period of economic contraction began sometime within the 12 months from 15 September 2025 through 15 September 2026.
The following update to the Recession Probability Track shows how the probability of recession has evolved from 20 January 2021 through 15 September 2025 in the context of how the difference between the yields of the 10-year and 3-month U.S. Treasuries combined with the level of the Federal Funds Rate have changed over this time.

Because Wright's recession forecasting method is forward-looking, here's a guide for interpreting what it has communicated about the periods in which the probability of recession has been elevated. The following chart presents the recession probability the recession forecasting model has projected aligned with the end of the period to which the forecast applies, covering the forecast periods from 30 April 1983 through 15 September 2026, which covers the historical data from which it was developed.

Here is a summary the full effective ranges of dates that apply for several key thresholds of elevated probabilities of recession that the model has projected. Note that we're still within the periods to which several of these heightened probabilities apply, which we've indicated with red boldface font.
50% Probability of Recession
- 13 February 2023 through 29 November 2025
60% Probability of Recession
- 25 April 2023 through 29 October 2025
70% Probability of Recession
- 25 May 2023 through 8 October 2024
- 31 January 2024 through 29 March 2025
- 5 September 2024 through 20 September 2025
The three sets of dates that apply for a 70% or greater probability of recession relate to the "triple-top" series of peaks the model recorded since mid-2023.
The end of the first period at this greatly elevated recession probability coincides with when the U.S. Federal Reserve initiated a new series of interest rate cuts that took place between September and December 2024 to forestall a recession from starting in the U.S. during the 2024 election season.
The first two periods coincide with a period of anemic job growth in the U.S. economy, which is confirmed by Bureau of Labor Statistics data that has undergone two massive downward revisions in the last 13 months.
The third period coincides with this week's timing for when the Federal Reserve is expected to resume cutting U.S. interest rates to address a slowing economy.
The most important thing to take away from this retrospective analysis is that Wright's recession model's forecasts for these elevated recession probabilities that apply today were set more than a year ago. Today's economic weakness has been baked in for a long, long time.
Looking forward, we anticipate the Fed's expected action to cut interest rates will finally cause the probability of recession to resume dropping to lower levels. We will continue following the Federal Reserve's Open Market Committee's meeting schedule in providing updates for the Recession Probability Track until the U.S. Treasury yield curve is no longer inverted, which has already happened, and the future recession odds retreat below a 20% threshold, which is yet to come. We think this second event may occur in the next six to twelve weeks.
Analyst's Notes
The recession probability we've presented is based on the Federal Reserve Board's yield curve-based recession forecasting model, which factors in the one-quarter average spread between the 10-year and 3-month constant maturity U.S. Treasuries and the corresponding one-quarter average level of the Federal Funds Rate. If you'd like to do that math using the latest data available to anticipate where the Recession Probability Track is heading, we have provided a tool to make it easy to do.
For the latest updates of the U.S. Recession Probability Track, follow this link!
Previously on Political Calculations
We started this new recession watch series on 18 October 2022, coinciding with the inversion of the 10-Year and 3-Month constant maturity U.S. Treasuries. Here are all the posts-to-date on that topic in reverse chronological order, including this one....
- U.S. Recession Probability as Fed Finally Set to Resume Rate Cuts
- U.S. Recession Odds Holding Mostly Steady with Fed Holding Off on Rate Cuts
- U.S. GDP Contracts as Recession Odds Tick Up with Fed on Hold
- Decline in U.S. Recession Odds Stalls with Pause in Fed Rate Cuts
- U.S. Recession Probability Plunges to 27%
- U.S. Recession Probability Drops Below 50%
- U.S. Recession Odds Fall with Fed Rate Cut, But Are Still Elevated
- Triple Top Pattern Locking In for U.S. Recession Probability
- Triple Top Developing for U.S. Recession Probability
- U.S. Probability of Recession in Next Twelve Months Hovers Near 70%
- Recession Probability Falls After Hitting Double-Top
- U.S. Recession Probability Nears a Double-Top
- Probability of U.S. Recession Resurges to Nearly 75%
- U.S. Recession Odds Recede to Two Out of Three Chance in 2024
- U.S. Recession Probability Continues Receding on All Hallow's Eve
- U.S. Recession Probability Starts to Recede
- Probability of Recession Starting in Next 12 Months Breaches 80%
- U.S. Recession Probability on Track to Rise Past 80%
- U.S. Recession Probability Reaches 67%
- U.S. Recession Probability Shoots Over 50% on Way to 60%
- Recession Probability Nearing 50%
- Recession Probability Ratchets Up to Better Than 1-in-6
- U.S. Recession Odds Rise Above 1-in-10
- The Return of the Recession Probability Track
Image Credit: Microsoft Copilot Designer. Prompt: "An editorial cartoon of Federal Reserve officials asking a Ouija board whether to cut interest rates where the pointer is on the word 'Yes'".
Labels: recession forecast


The probability that the National Bureau of Economic Research will someday determine a national recession began in the U.S. between December 2025 and December 2026 has fallen below twenty percent.
That is the lowest probability returned by a recession forecasting method that we've been following since December 2022, which we started tracking after the U.S. Treasury yield curve inverted in October 2022. This method was developed by Jonathan Wright while working for the Federal Reserve Board back in 2006. It incorporates the one-quarter averages of the spread between the 10-Year and 3-Month constant maturity U.S. Treasuries and the level of the Federal Funds Rate to anticipate, within a 12-month period from an observation date, what the probability the U.S. economy will be in a period of contraction according to criteria used by the NBER.
The reason we're following it is because it often takes the NBER months to get around to making that determination after a recession has started. And since a yield curve inversion, when the yield of a 3-Month Treasury is higher than the yield of 10-Year Treasury, is often a harbinger of recession, using a recession forecasting method built using historic data that incorporates it can be useful.
The current recession probability level has been achieved following the two reductions in the Federal Funds Rate the Fed has made in the last three months. These cuts have lowered this base interest rate to a target range of 3.75-4.00%. Investors expect the Fed will act again on Wednesday, 10 December 2025 to lower it by another quarter percent to a target range of 3.50-3.75%, the lowest it has been since October 2022.
The following update to the Recession Probability Track shows how the probability of recession has evolved from 20 January 2021 through 8 December 2025 in the context of how the difference between the yields of the 10-year and 3-month U.S. Treasuries combined with the level of the Federal Funds Rate have changed over this time.

Because Wright's method looks to see whether any of the next twelve months into the future will contain a month the NBER will determine marks the peak of a business cycle, or rather Month 0 of a period of economic contraction, having the latest recession probability falling below the 20% threshold doesn't mean the U.S. economy is out of the woods. We've summarized what periods Wright's method has indicated since we've been tracking it for this series is most likely to include that Month 0:
50% Probability of Recession
- 13 February 2023 through 29 November 2025
60% Probability of Recession
- 25 April 2023 through 29 October 2025
70% Probability of Recession
- 25 May 2023 through 8 October 2024
- 31 January 2024 through 29 March 2025
- 5 September 2024 through 20 September 2025
These are the periods the recession forecasting method predicts the National Bureau of Economic Research will someday identify as containing the month in which a period of economic contraction began. The three sets of dates that apply for a 70% or greater probability of recession relate to a "triple-top" series of peaks the model has recorded since mid-2023.
The end of the first period at this greatly elevated recession probability coincides with when the U.S. Federal Reserve initiated a new series of interest rate cuts that took place between September and December 2024 to forestall a recession from starting in the U.S. during the 2024 election season.
The first two periods coincide with a period of anemic job growth in the U.S. economy, which is confirmed by Bureau of Labor Statistics data that has undergone two massive downward revisions, confirming the labor market was far weaker than initially reported.
The third period coincides with the timing for when the Federal Reserve resumed cutting U.S. interest rates to address a slowing economy in September 2025.
The most important thing to take away from this retrospective analysis is that the recession model's forecasts for these elevated recession probabilities were set more than a year ago. Today's economic weakness has been baked in for a very long time.
Analyst's Notes
This is the end of the road for our series! Both our criteria for terminating the series have now been met: the U.S. Treasury yield curve has not been inverted since September 2025 and the recession probability threshold finally dropped below 20% this month. If you still want to follow recession probability estimates, there are alternate estimates based on different methods that will give you a current estimate.
The recession probability we've presented is based on the Federal Reserve Board's yield curve-based recession forecasting model, which factors in the one-quarter average spread between the 10-year and 3-month constant maturity U.S. Treasuries and the corresponding one-quarter average level of the Federal Funds Rate. If you'd like to do that math using the latest data available to anticipate where the Recession Probability Track is heading, we have provided a tool to make it easy to do.
For the latest updates of the U.S. Recession Probability Track, follow this link!
Previously on Political Calculations
We started this new recession watch series on 18 October 2022, coinciding with the inversion of the 10-Year and 3-Month constant maturity U.S. Treasuries. Here are all the posts-to-date on that topic in reverse chronological order, including this one....
- U.S. Recession Probability Drops Below 20%
- U.S. Recession Probability Falls After Fed Resumes Rate Cuts, Set to Fall Further
- U.S. Recession Probability as Fed Finally Set to Resume Rate Cuts
- U.S. Recession Odds Holding Mostly Steady with Fed Holding Off on Rate Cuts
- U.S. GDP Contracts as Recession Odds Tick Up with Fed on Hold
- Decline in U.S. Recession Odds Stalls with Pause in Fed Rate Cuts
- U.S. Recession Probability Plunges to 27%
- U.S. Recession Probability Drops Below 50%
- U.S. Recession Odds Fall with Fed Rate Cut, But Are Still Elevated
- Triple Top Pattern Locking In for U.S. Recession Probability
- Triple Top Developing for U.S. Recession Probability
- U.S. Probability of Recession in Next Twelve Months Hovers Near 70%
- Recession Probability Falls After Hitting Double-Top
- U.S. Recession Probability Nears a Double-Top
- Probability of U.S. Recession Resurges to Nearly 75%
- U.S. Recession Odds Recede to Two Out of Three Chance in 2024
- U.S. Recession Probability Continues Receding on All Hallow's Eve
- U.S. Recession Probability Starts to Recede
- Probability of Recession Starting in Next 12 Months Breaches 80%
- U.S. Recession Probability on Track to Rise Past 80%
- U.S. Recession Probability Reaches 67%
- U.S. Recession Probability Shoots Over 50% on Way to 60%
- Recession Probability Nearing 50%
- Recession Probability Ratchets Up to Better Than 1-in-6
- U.S. Recession Odds Rise Above 1-in-10
- The Return of the Recession Probability Track
Image Credit: Microsoft Copilot Designer. Prompt: "An editorial cartoon of a Federal Reserve official looking into a crystal ball that says 'RECESSION? ASK AGAIN LATER'".
Labels: recession forecast

The probability a U.S. recession will someday be determined to have begun between December 2024 and December 2025 has dropped below 50%.
This assessment is based on the yield curve-based recession forecasting model developed by Jonathan Wright in 2006. Going by this model, the odds of a U.S. recession in the next year dropped below the 50% threshold on 1 December 2024.
The main factor lowering the probability of a recession beginning in this period is the Federal Reserve's interest rate rates during 2024. The Fed's reductions to the Federal Funds Rate has released some of the building recessionary pressure from the Fed having boosted short term interest rates in 2022 and 2023 to combat the Biden-Harris administration's inflation.
With the Federal Funds Rate being reduced, the yields of short-term U.S. Treasuries have followed, further reducing the recession start probability. The following chart tracking the probability of recession since 30 April 1983, the period from July 2024 through mid-September 2025 represents the most likely period in which the NBER will say the U.S. economy peaked before beginning a period of contraction.

The current probability of a recession being officially determined to have begun between 1 November 2024 and 16 December 2025 is 42.9%. The featured chart shows that probability 'pushed out' to the end of the period for which the recession forecast applies.
And now that the Federal Funds Rate is not being held at a fixed level for a sustained period of time, we can resume updating the Recession Probability Track, which provides additional information about the factors that influence Wright's recession forecasting model.

With the Fed set to reduce the Federal Funds Rate by another quarter point on 18 December 2024, we anticipate the Recession Probability Track will continue its downward trajectory in the weeks ahead.
Analyst's Notes
As mentioned, the recession probability presented here is based on the Federal Reserve Board's yield curve-based recession forecasting model, which factors in the one-quarter average spread between the 10-year and 3-month constant maturity U.S. Treasuries and the corresponding one-quarter average level of the Federal Funds Rate. If you'd like to do that math using the latest data available to anticipate where the Recession Probability Track is heading, we have provided a tool to make it easy to do.
We will continue following the Federal Reserve's Open Market Committee's meeting schedule in providing updates for the Recession Probability Track until the U.S. Treasury yield curve is no longer inverted and the future recession odds retreat below a 20% threshold. We're following how this forecasting method performs and we anticipate this level may be reached in mid-2025.
For the latest updates of the U.S. Recession Probability Track, follow this link!
Previously on Political Calculations
We started this new recession watch series on 18 October 2022, coinciding with the inversion of the 10-Year and 3-Month constant maturity U.S. Treasuries. Here are all the posts-to-date on that topic in reverse chronological order, including this one....
- U.S. Recession Probability Drops Below 50%
- U.S. Recession Odds Fall with Fed Rate Cut, But Are Still Elevated
- Triple Top Pattern Locking In for U.S. Recession Probability
- Triple Top Developing for U.S. Recession Probability
- U.S. Probability of Recession in Next Twelve Months Hovers Near 70%
- Recession Probability Falls After Hitting Double-Top
- U.S. Recession Probability Nears a Double-Top
- Probability of U.S. Recession Resurges to Nearly 75%
- U.S. Recession Odds Recede to Two Out of Three Chance in 2024
- U.S. Recession Probability Continues Receding on All Hallow's Eve
- U.S. Recession Probability Starts to Recede
- Probability of Recession Starting in Next 12 Months Breaches 80%
- U.S. Recession Probability on Track to Rise Past 80%
- U.S. Recession Probability Reaches 67%
- U.S. Recession Probability Shoots Over 50% on Way to 60%
- Recession Probability Nearing 50%
- Recession Probability Ratchets Up to Better Than 1-in-6
- U.S. Recession Odds Rise Above 1-in-10
- The Return of the Recession Probability Track
Image Credit: Microsoft Copilot Designer. Prompt: "An editorial cartoon of a Federal Reserve official who is trying to use a crystal ball to tell the future".
Labels: recession forecast

The odds a U.S. recession will someday be determined to have begun between January 2025 and January 2026 has dropped to a little higher than a one-in-four chance.
This assessment is based on the yield curve-based recession forecasting model developed by Jonathan Wright in 2006. Going by this model, the odds of a U.S. recession being found to have started within the next year is a little over 27%.
The main factor lowering the probability of a recession beginning in the last several months is the Federal Reserve's interest rate cuts during 2024. The Fed's reductions to the Federal Funds Rate have released some of the building recessionary pressure from the Fed having boosted short term interest rates in 2022 and 2023 to combat the Biden-Harris administration's inflation.
With the Federal Funds Rate being reduced, the yields of short-term U.S. Treasuries have followed, further reducing the recession start probability. The following chart tracking the probability of recession since 30 April 1983, the period from July 2024 through mid-September 2025 represents the most likely period in which the NBER will say the U.S. economy peaked before beginning a period of contraction.

This chart shows the recession probability 'pushed out' to the end of the period for which the recession forecast applies, which gives a "glass half empty" view of the recession probability data.
We've also updated the Recession Probability Track, which provides additional information about the factors that influence Wright's recession forecasting model.

We will continue following the Federal Reserve's Open Market Committee's meeting schedule in providing updates for the Recession Probability Track until the U.S. Treasury yield curve is no longer inverted and the future recession odds retreat below a 20% threshold.
At this writing, the first criteria has been met. The U.S. Treasury yield curve is no longer inverted, as the yield of the 10-year Treasury is now higher than the yield of the 3-month Treasury.
It will take longer for the second criteria to be met. We now anticipate the decline of the recession probability will slow and stall out above the 20% threshold in the weeks ahead in the absence of any additional interest rate cuts by the Fed in the next several months. That will change as we approach the second half of 2025, as the Fed is expected to cut the Federal Funds Rate by a quarter point when it meets in late June.
Analyst's Notes
The recession probability we've presented is based on the Federal Reserve Board's yield curve-based recession forecasting model, which factors in the one-quarter average spread between the 10-year and 3-month constant maturity U.S. Treasuries and the corresponding one-quarter average level of the Federal Funds Rate. If you'd like to do that math using the latest data available to anticipate where the Recession Probability Track is heading, we have provided a tool to make it easy to do.
For the latest updates of the U.S. Recession Probability Track, follow this link!
Previously on Political Calculations
We started this new recession watch series on 18 October 2022, coinciding with the inversion of the 10-Year and 3-Month constant maturity U.S. Treasuries. Here are all the posts-to-date on that topic in reverse chronological order, including this one....
- U.S. Recession Probability Plunges to 27%
- U.S. Recession Probability Drops Below 50%
- U.S. Recession Odds Fall with Fed Rate Cut, But Are Still Elevated
- Triple Top Pattern Locking In for U.S. Recession Probability
- Triple Top Developing for U.S. Recession Probability
- U.S. Probability of Recession in Next Twelve Months Hovers Near 70%
- Recession Probability Falls After Hitting Double-Top
- U.S. Recession Probability Nears a Double-Top
- Probability of U.S. Recession Resurges to Nearly 75%
- U.S. Recession Odds Recede to Two Out of Three Chance in 2024
- U.S. Recession Probability Continues Receding on All Hallow's Eve
- U.S. Recession Probability Starts to Recede
- Probability of Recession Starting in Next 12 Months Breaches 80%
- U.S. Recession Probability on Track to Rise Past 80%
- U.S. Recession Probability Reaches 67%
- U.S. Recession Probability Shoots Over 50% on Way to 60%
- Recession Probability Nearing 50%
- Recession Probability Ratchets Up to Better Than 1-in-6
- U.S. Recession Odds Rise Above 1-in-10
- The Return of the Recession Probability Track
Image Credit: Microsoft Copilot Designer. Prompt: "An editorial cartoon of a banker having their palm read by a fortune teller with the Federal Reserve in the background".
Labels: recession forecast

After pausing for nine months, the U.S. Federal Reserve resumed cutting interest rates on 17 September 2025. The Fed reduced the Federal Funds Rate by a quarter percent to a target range of 4.00-4.25%.
As expected, this action reduced the probability a recession will begin in the next twelve months. The recession forecasting method we've used to monitor the odds of recession starting in the U.S. indicates the recession probability has dipped from 26.5% six weeks ago to 23.7% as the Fed appears set to reduce U.S. interest rates further.
We anticipate that action will continue pushing the odds of a U.S. recession starting in the next twelve months down slowly because of the expected small size of its imminent rate cut. We project that in the next six weeks, the probability of a U.S. recession getting started in the next twelve months will be around 21%.
Then, assuming the Fed acts again in six weeks to cut U.S. interest rates by another quarter point, as is currently expected by the CME Group's FedWatch Tool, we should see the recession probability drop below the key 20% threshold in early 2026.
The following update to the Recession Probability Track shows how the probability of recession has evolved from 20 January 2021 through 15 September 2025 in the context of how the difference between the yields of the 10-year and 3-month U.S. Treasuries combined with the level of the Federal Funds Rate have changed over this time.

A 20% probability represents the "background" probability of recession for the U.S. economy. By this, we mean that if you packed a bag a marbles identified with every month and year the United States has been an independent nation and picked one at random, you would have a 20% chance of picking a marble with a date the U.S. economy was in recession. We plan to end this series after the probability of recession drops below this probability threshold.
However, that doesn't mean the U.S. economy is not experiencing recessionary conditions today, for which there are some indications of distress:
It often seems that economists are perpetually warning us about the next U.S. recession. One influential analyst says an economic slowdown is already a fact of life for many Americans.
Twenty-two states are “now experiencing persistent economic weakness and job losses that are likely to continue," said Mark Zandi, the chief economist at Moody’s Analytics, to MarketWatch. The overall American economy is “on the precipice. Government data released before the shutdown showed the “broader economy was in pretty good shape,” said MarketWatch, but some are skeptical. The gross domestic product might be rising, said Zandi, but the “job market is weaker.”
Other observers are warning of a bifurcated “K-shaped economy,” said CNBC. Wealthy Americans are “engaging their purchasing power,” but lower- and middle-class consumers are struggling with “rising costs on daily essentials like groceries and gas.” Meanwhile, “unofficial signals” like rises in missed car payments and women leaving the workforce are offering “early warning signs about what is to come,” said Quartz.
These conditions haven't developed in a vacuum. The onset of these conditions have coincided with elevated probabilities of recession that the recession forecasting model we track was projecting more than a year ago. Here's a short summary of when the model anticipated those conditions could develop into a higher likelihood of recession.
50% Probability of Recession
- 13 February 2023 through 29 November 2025
60% Probability of Recession
- 25 April 2023 through 29 October 2025
70% Probability of Recession
- 25 May 2023 through 8 October 2024
- 31 January 2024 through 29 March 2025
- 5 September 2024 through 20 September 2025
These are the periods the recession forecasting method predicts the National Bureau of Economic Research will someday identify as containing the month in which a period of economic contraction began. Note that we're still within the periods to which several of these heightened probabilities apply, which we've indicated with red boldface font.
The three sets of dates that apply for a 70% or greater probability of recession relate to a "triple-top" series of peaks the model has recorded since mid-2023.
The end of the first period at this greatly elevated recession probability coincides with when the U.S. Federal Reserve initiated a new series of interest rate cuts that took place between September and December 2024 to forestall a recession from starting in the U.S. during the 2024 election season.
The first two periods coincide with a period of anemic job growth in the U.S. economy, which is confirmed by Bureau of Labor Statistics data that has undergone two massive downward revisions in the last 13 months.
The third period coincides with the timing for when the Federal Reserve resumed cutting U.S. interest rates to address a slowing economy in September 2025.
The most important thing to take away from this retrospective analysis is that the recession model's forecasts for these elevated recession probabilities were set more than a year ago. Today's economic weakness has been baked in for a very long time.
Analyst's Notes
The recession probability we've presented is based on the Federal Reserve Board's yield curve-based recession forecasting model, which factors in the one-quarter average spread between the 10-year and 3-month constant maturity U.S. Treasuries and the corresponding one-quarter average level of the Federal Funds Rate. If you'd like to do that math using the latest data available to anticipate where the Recession Probability Track is heading, we have provided a tool to make it easy to do.
For the latest updates of the U.S. Recession Probability Track, follow this link!
Previously on Political Calculations
We started this new recession watch series on 18 October 2022, coinciding with the inversion of the 10-Year and 3-Month constant maturity U.S. Treasuries. Here are all the posts-to-date on that topic in reverse chronological order, including this one....
- U.S. Recession Probability Falls After Fed Resumes Rate Cuts, Set to Fall Further
- U.S. Recession Probability as Fed Finally Set to Resume Rate Cuts
- U.S. Recession Odds Holding Mostly Steady with Fed Holding Off on Rate Cuts
- U.S. GDP Contracts as Recession Odds Tick Up with Fed on Hold
- Decline in U.S. Recession Odds Stalls with Pause in Fed Rate Cuts
- U.S. Recession Probability Plunges to 27%
- U.S. Recession Probability Drops Below 50%
- U.S. Recession Odds Fall with Fed Rate Cut, But Are Still Elevated
- Triple Top Pattern Locking In for U.S. Recession Probability
- Triple Top Developing for U.S. Recession Probability
- U.S. Probability of Recession in Next Twelve Months Hovers Near 70%
- Recession Probability Falls After Hitting Double-Top
- U.S. Recession Probability Nears a Double-Top
- Probability of U.S. Recession Resurges to Nearly 75%
- U.S. Recession Odds Recede to Two Out of Three Chance in 2024
- U.S. Recession Probability Continues Receding on All Hallow's Eve
- U.S. Recession Probability Starts to Recede
- Probability of Recession Starting in Next 12 Months Breaches 80%
- U.S. Recession Probability on Track to Rise Past 80%
- U.S. Recession Probability Reaches 67%
- U.S. Recession Probability Shoots Over 50% on Way to 60%
- Recession Probability Nearing 50%
- Recession Probability Ratchets Up to Better Than 1-in-6
- U.S. Recession Odds Rise Above 1-in-10
- The Return of the Recession Probability Track
Image Credit: Microsoft Copilot Designer. Prompt: "An editorial cartoon of Federal Reserve officials meeting with a carnival fortune teller as they decide how to change interest rates".
Labels: recession forecast

Real economic growth in the United States contracted 0.3% in the first quarter of 2025.
Although that's an initial estimate, that's a remarkable development because it comes in the middle of a period in which the recession forecasting model we've tracked every six weeks since October 2022 signaled the probability of such an event would be exceptionally high.
But more to the point, those signals were sent more than a year ago.
The following chart shows how the probability of a recession based on a yield curve-based recession forecasting model developed by Jonathan Wright for the Federal Reserve Board in 2006 has evolved over the past 43 years.

The period from July 2024 through mid-September 2025 represents the most likely period in which the National Bureau of Economic Research will someday get around to saying the U.S. economy peaked before beginning a period of contraction. Should the NBER identify a month within this period as the starting month for a new recession, or business cycle contraction in the NBER's terminology, Wright's recession forecasting model suggests it is because it was "baked in" well before 2025 began.
Jumping forward to the present, Wright's recession forecasting model has risen over the past six weeks after stalling as expected because the Federal Reserve chose to pause its latest series of interest rate cuts after its 19 December 2024 quarter point rate cut of the Federal Funds Rate. The probability has increased to nearly 26%, where it had previously bottomed at 20%. Here's the latest update to the Recession Probability Track:

This newest estimate applies to the probability the NBER will someday pick a month between 5 May 2025 and 5 May 2026 as the starting point for a period of economic contraction for the U.S. economy.
Looking forward, we anticipate the forecast recession probability will remain around this level in the near term because Federal Reserve officials appear set to continue their pause in rate cuts. At present, the CME Group's FedWatch Tool projects the Fed will decline resuming its rates cuts until the conclusion of its 30 July (2025-Q3) meeting. However, the FedWatch Tool anticipates the Fed will reduce U.S. interest rates three times before the end of 2025, anticipating 0.25% cuts in the Federal Funds Rate on 30 July (2025-Q3), 17 September (2025-Q3), and 29 October (2025-Q4).
Absent a deep inversion of the U.S. Treasury yield curve, we think the forecast recession probability will likely remain near its current level until the Fed resumes cutting short-term U.S. interest rates.
We will continue following the Federal Reserve's Open Market Committee's meeting schedule in providing updates for the Recession Probability Track until the U.S. Treasury yield curve is no longer inverted and the future recession odds retreat below a 20% threshold.
Analyst's Notes
The recession probability we've presented is based on the Federal Reserve Board's yield curve-based recession forecasting model, which factors in the one-quarter average spread between the 10-year and 3-month constant maturity U.S. Treasuries and the corresponding one-quarter average level of the Federal Funds Rate. If you'd like to do that math using the latest data available to anticipate where the Recession Probability Track is heading, we have provided a tool to make it easy to do.
For the latest updates of the U.S. Recession Probability Track, follow this link!
Previously on Political Calculations
We started this new recession watch series on 18 October 2022, coinciding with the inversion of the 10-Year and 3-Month constant maturity U.S. Treasuries. Here are all the posts-to-date on that topic in reverse chronological order, including this one....
- U.S. GDP Contracts as Recession Odds Tick Up with Fed on Hold
- Decline in U.S. Recession Odds Stalls with Pause in Fed Rate Cuts
- U.S. Recession Probability Plunges to 27%
- U.S. Recession Probability Drops Below 50%
- U.S. Recession Odds Fall with Fed Rate Cut, But Are Still Elevated
- Triple Top Pattern Locking In for U.S. Recession Probability
- Triple Top Developing for U.S. Recession Probability
- U.S. Probability of Recession in Next Twelve Months Hovers Near 70%
- Recession Probability Falls After Hitting Double-Top
- U.S. Recession Probability Nears a Double-Top
- Probability of U.S. Recession Resurges to Nearly 75%
- U.S. Recession Odds Recede to Two Out of Three Chance in 2024
- U.S. Recession Probability Continues Receding on All Hallow's Eve
- U.S. Recession Probability Starts to Recede
- Probability of Recession Starting in Next 12 Months Breaches 80%
- U.S. Recession Probability on Track to Rise Past 80%
- U.S. Recession Probability Reaches 67%
- U.S. Recession Probability Shoots Over 50% on Way to 60%
- Recession Probability Nearing 50%
- Recession Probability Ratchets Up to Better Than 1-in-6
- U.S. Recession Odds Rise Above 1-in-10
- The Return of the Recession Probability Track
Image Credit: Microsoft Copilot Designer. Prompt: "An editorial cartoon of a Federal Reserve official looking at a crystal ball that says 'RECESSION'".
Labels: recession forecast
The probability the U.S. economy will see a recession begin sometime in the next twelve months has started to fall again during the past six weeks. after having hit a double-top.
Since our previous update, the probability has dropped from over 76% to just under 71%, confirming the double-top after having previously peaked at 81% in July 2023.
These probabilities are determined using a recession forecasting method developed for the Federal Reserve Board in 2006. They represent a portion of the economic data and forecasts Federal Reserve officials will consider as they meet from 30 April to 1 May 2024 to review how they will set the level of short term interest rates in the United States in the months ahead. The expected timing of rate cuts by the Fed has been slipping later and later during the past six weeks.
The following chart presents the latest update of the Recession Probability Track. It reveals how that probability appears as the Federal Reserve's Open Market Committee (FOMC) goes into its April 2024 meetings to review and potentially change the Federal Funds Rate (FFR). The FOMC is expected to continue holding the FFR steady at this meeting, but is expected to start lowering this core interest rate at later meetings in 2024. Markets anticipate the Fed may cut this interest rate at its September 2024 meeting.
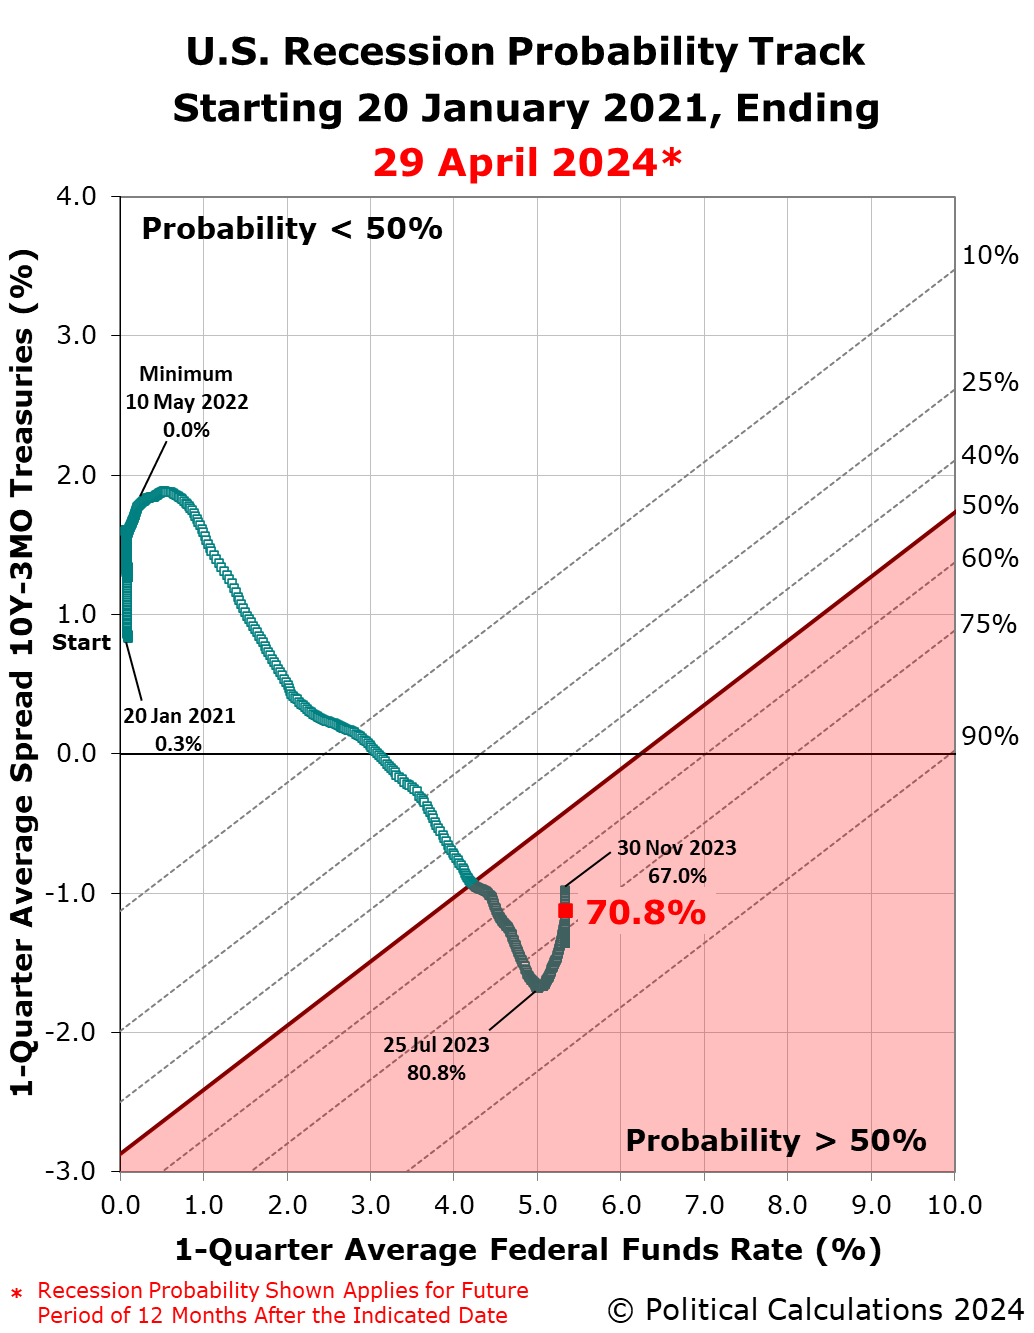
The Recession Probability Track indicates the probability a recession will someday be officially determined to have begun sometime in the next 12 months. For this update, that applies to the dates between 29 April 2024 and 29 April 2025.
The double-top pattern we've described at the beginning of this article can be better seen by simply tracking the recession probability over time. The next chart shows that forecast probability using the data available from 30 April 1983 through 29 April 2024, with the probabilities shown shifted 12 months into the future to coincide with the end of the period in which they apply.

The probability of recession peaked at nearly 81% on 25 July 2023, making the period from July 2023 through July 2024 the mostly likely period in which the National Bureau of Economic Research will someday identify a point of time marking the peak in the U.S. business cycle before it entered a period of contraction. The prolonged elevation of the Federal Funds Rate combined the deepened inversion of the U.S. Treasury yield curve in recent weeks has made the period between 18 March 2024 and 18 March 2025 the second most-likely period that will include the peak of a business cycle that marks when a recession began.
Another way to interpret the double-top pattern is to consider that it extends the period in which the highest probability of recession is elevated. Under that interpretation, the period in which the probability of an official recession starting would be greater than 70% is running from 25 July 2023 through at least 29 April 2025.
Only time will tell if that's an appropriate way to interpret the data. Looking at the underlying data that's used to determine the recession probability, we anticipate it will continue falling in the near term, making a "triple-top" event unlikely.
Analyst's Notes
The Recession Probability Track is based on Jonathan Wright's yield curve-based recession forecasting model, which factors in the one-quarter average spread between the 10-year and 3-month constant maturity U.S. Treasuries and the corresponding one-quarter average level of the Federal Funds Rate. If you'd like to do that math using the latest data available to anticipate where the Recession Probability Track is heading, we have provided a tool to make it easy to do.
We will continue following the Federal Reserve's Open Market Committee's meeting schedule in providing updates for the Recession Probability Track until the U.S. Treasury yield curve is no longer inverted and the future recession odds retreat below a 20% threshold. We're curious to see how this forecasting method performs.
For the latest updates of the U.S. Recession Probability Track, follow this link!
Previously on Political Calculations
We started this new recession watch series on 18 October 2022, coinciding with the inversion of the 10-Year and 3-Month constant maturity U.S. Treasuries. Here are all the posts-to-date on that topic in reverse chronological order, including this one....
- Recession Probability Falls After Hitting Double-Top
- U.S. Recession Probability Nears a Double-Top
- Probability of U.S. Recession Resurges to Nearly 75%
- U.S. Recession Odds Recede to Two Out of Three Chance in 2024
- U.S. Recession Probability Continues Receding on All Hallow's Eve
- U.S. Recession Probability Starts to Recede
- Probability of Recession Starting in Next 12 Months Breaches 80%
- U.S. Recession Probability on Track to Rise Past 80%
- U.S. Recession Probability Reaches 67%
- U.S. Recession Probability Shoots Over 50% on Way to 60%
- Recession Probability Nearing 50%
- Recession Probability Ratchets Up to Better Than 1-in-6
- U.S. Recession Odds Rise Above 1-in-10
- The Return of the Recession Probability Track
Image Credit: Microsoft Copilot Designer. Prompt: "A signpost with the words 'Recession Ahead?'"
Labels: recession forecast
Welcome to the blogosphere's toolchest! Here, unlike other blogs dedicated to analyzing current events, we create easy-to-use, simple tools to do the math related to them so you can get in on the action too! If you would like to learn more about these tools, or if you would like to contribute ideas to develop for this blog, please e-mail us at:
ironman at politicalcalculations
Thanks in advance!
Closing values for previous trading day.
This site is primarily powered by:

CSS Validation

RSS Site Feed

JavaScript
The tools on this site are built using JavaScript. If you would like to learn more, one of the best free resources on the web is available at W3Schools.com.
Other Cool Resources
Blog Roll


