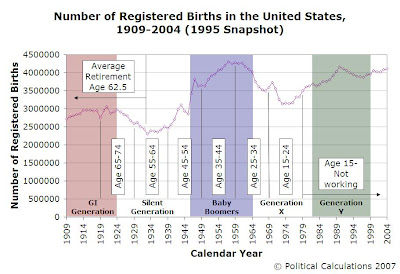
We're going to wrap up our look at how the distribution of inflation-adjusted income has changed by age group from 1995 to 2005 this week, so we thought we'd start the grand finale by looking again at the generational demographics of our income earners in both years.
We'll first look at where our age groups fall among the United States' generational divisions, going by registered births, first for 1995:

And 10 years later:

So, right off the bat you can see that there's a strong generational component behind the number of potential income-earners in each age group as they advance through time, which is in good part reflected by the number of registered births within our age ranges. The following table adds up the birth numbers, and lists the number of income earners between $0 and $95,000 (in 2004 US dollars) for both 1995 and 2005:
| Age Groups and Income Earners for 1995 and 2005 | |||||
|---|---|---|---|---|---|
| Birth Year Range | Age Group in 1994 | Age Group in 2004 | Registered Births | 1994 Income Earners | 2004 Income Earners |
| 1920-1929 | Age 65-74 | Over Age 75 | 28,582,000 | 18,320,102 | N/A |
| 1930-1939 | Age 55-64 | Age 65-74 | 24,374,000 | 18,468,644 | 17,958,307 |
| 1940-1949 | Age 45-54 | Age 55-64 | 31,666,000 | 26,741,030 | 25,410,246 |
| 1950-1959 | Age 35-44 | Age 45-54 | 40,530,000 | 37,690,015 | 35,723,625 |
| 1960-1969 | Age 25-34 | Age 35-44 | 38,808,409 | 37,991,817 | 36,606,962 |
| 1970-1979 | Age 15-24 | Age 25-34 | 33,308,985 | 26,725,555 | 33,986,844 |
| 1980-1989 | Under Age 15 | Age 15-24 | 37,507,107 | N/A | 27,243,902 |
Note: We highlighted the number of income earners for birth years between 1970 and 1979 (specifically, 2005's Age 25-34), since this figure is actually larger than the number of registered births for those years. That's very likely a lot of immigration inflating the numbers of the domestic U.S. workforce!
In addition to the provided data, the table above also indicates why we selected the years of 1995 and 2005 for our income distribution analysis. Since the Current Population Surveys released in March of these years really reflect data captured for 1994 and 2004, and given how the CPS provides its age group breakdowns beginning with Age 15-24 (and so on), these years made a nice natural fit with the decades for when people within each age group were born!
And you thought we were going completely at random!...
Previously on Political Calculations
- Income/Age Percentiles in Pictures
- Comparing the U.S. Distribution of Income by Age Group and Year
- Distributing Income by Age Grop in the US: Ten Years Older
- Estimating the U.S. Distribution of Income by Age
- The Shifting Demographics of Age and Income
- Income/Age Demographic Snapshots of 1995 and 2005
- Raking It In: The Baby Boomers from 1995 to 2005
- The Distribution of Income Earners by Age Group for 1995 and 2005
- Changing Apples into Oranges
- 1995 U.S. Individual Income by Age Group Data
- The Distribution of Income by Age in 1995
- Income Distribution Percentages by Age in the U.S. (2005)
- Peak Earning Years for U.S. Individuals (2005)
- The Distribution of Income by Age in the U.S. (2005)
- Generations
Labels: demographics
Welcome to the blogosphere's toolchest! Here, unlike other blogs dedicated to analyzing current events, we create easy-to-use, simple tools to do the math related to them so you can get in on the action too! If you would like to learn more about these tools, or if you would like to contribute ideas to develop for this blog, please e-mail us at:
ironman at politicalcalculations
Thanks in advance!
Closing values for previous trading day.
This site is primarily powered by:
CSS Validation
RSS Site Feed
JavaScript
The tools on this site are built using JavaScript. If you would like to learn more, one of the best free resources on the web is available at W3Schools.com.