Here's what we mean by teens being marginal employees. Since the vast majority of teens Age 16-19 are dependents of other income-earning individuals and who do not need to fully support themselves as a result, teens are able to enter or leave the workforce without many of the same penalties that fully self-sufficient individuals would face. By comparison, only seniors, those near, at or above retirement age, might also be considered to be marginal employees in this regard, as they often have retirement income upon which to support themselves should they not have an income-generating job.
But teens have other unique characteristics that make them stand out from all other employed persons in the United States. Compared to nearly all other older employed individuals in the U.S. workforce, they are unskilled, untrained and inexperienced. As a result of these conditions, teens who work will be most often found in entry level jobs that don't pay much money. Consequently, we see that teens represent a disproportionate share of those who earn the federal minimum wage. For reference, through 2007, those Age 16 to 19 made up 21.6% of those who earn the federal minimum wage (or less) [see chart].
These factors combine to make the U.S. teenage workforce especially sensitive to external factors affecting the number of jobs made available to them. While we would expect that the number of employed individuals in the U.S. would rise and fall with general economic conditions, the marginal nature of working teens makes this portion of the workforce visibly reactive to changes in the minimum wage.
Previously, we've noted that teenagers would seem to be disappearing from the U.S. workforce. Today, we're going to go back to identify where, and when, those job disappearances began.
To do that, we're going to introduce an idea we call "statistical dating."
Statistical Dating
We're not talking about the guy walking down the street who asks a thousand women if they'll go on a date with him in the hopes that one will eventually say yes! Instead, we're going to identify a period of time in which the number of teens in the U.S. workforce would appear to be in equilibrium with the rest of the U.S. workforce, find the range in which we would expect all the measures of the relative number of teens to be the result of natural causes, then identify where and when something not natural results in breaking that established state of equilibrium.
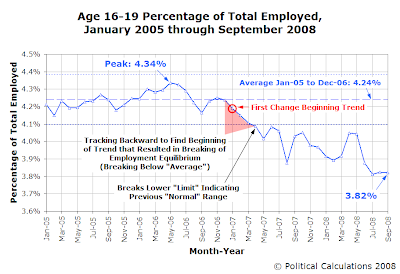
If that sounds like a statistical control chart to you, you're right! In the chart below, we've found the percentage of those Age 16-19 to the entire Age 16+ workforce as we determined from data given by the U.S. Bureau of Labor Statistics' Current Population Survey (CPS) Labor Force Statistics from January 2005 through September 2008:

In this chart, we see that the relative percentage of teens to the total U.S. workforce was largely stable around an average of 4.24% from January 2005 through December 2006. The "dotted" lines indicate the normal range about which we would anticipate that 99% of all results, each drawn at a value three times the standard deviation of the data away from the mean during this period.
We see that teens reached the peak of their employment as a percentage of the total U.S. workforce in May 2006, a level of 4.34%, which is well within the range that we would anticipate as being the result of natural variation. We see though that the percentage of working teens falls below the lower level of what we would expect if that previous equilibrium was still in force in April 2007, and that this change is sustained - the percentage of teens to the total workforce does not rise back into that range afterward.
We see that this break in the previous equilibrium was the result of a sustained downward trend. Here, there are a couple of potential "starting" points from which to gauge when the sustained decline breaking the previous state of equilibrium began. We could to back to the previous peak before the decline got underway, November 2006, or we could go back to when the decline we observe began gathering serious momentum, January 2007.
As it happens, both dates are significant in driving the decline of the relative percentage of teens in the U.S. workforce, but we've opted to mark January 2007 as the effective beginning of the decline.
What Happened to Drive Down Teen Employment?
In the next series of charts we're going to present, we're going to follow the practice suggested by King Banaian, in which all data is measured from when the employment level reached its most recent peak of expansion. For those Age 16-19, we previously observed that recent peak of expansion occurred in May 2006 when the percentage of teens with respect to the total U.S. workforce reached a level of 4.34%.
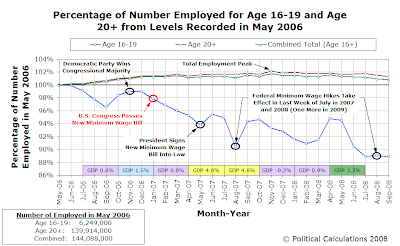
In our next chart, we've combined a lot of data. Here, beginning from our base of May 2006, we've indicated how the size of the Age 16-19, Age 20+ and the total U.S. workforce has changed through September 2008 as a percentage of the size of each in May 2006. We therefore see each portion of the workforce begin with a value of 100% of their May 2006 starting value, then the percentage of that value counted as being employed in each subsequent month.
We've also indicated the annualized economic growth rates recorded by the Bureau of Economic Analysis over the full quarters spanning the data we show in our chart. We should expect that when economic growth is cold (purple), employment levels should tend to decline, when growth is cool (blue), employment levels should tend to be flat, when growth is good, employment levels should rise slowly, and when growth is warm (yellow), employment levels should rise more quickly.
Beyond those features, we've identified when certain milestones in the federal minimum wage occurred.
Had enough suspense? Here's the chart:

Here, we see that the beginning of the sustained decline in teen employment levels directly correlates to when the U.S. House of Representatives and the U.S Senate passed measures to increase the federal minimum wage in the U.S. from the long existing level of $5.15 per hour to $5.85 per hour on July 24, 2007, $6.55 per hour on July 24, 2008 and $7.25 per hour on July 24, 2009.
We observe that the federal minimum wage coincide with unexpected anomalies in teen employment levels. For example, when the first of the three legislated minimum wage hikes occurred in late July 2007, we find that teen employment levels suddenly plunged in the month of August 2007, despite a sustained economic growth rate of 4.8% during that period.
We also see that teen employment levels have been moving progressively lower, setting new floors with each increase in the minimum wage.
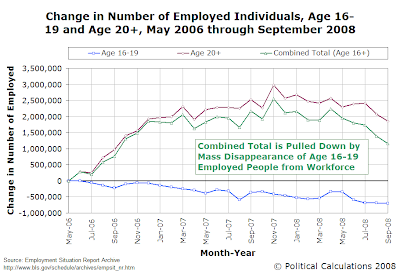
Now, these percentages are nice, but you hopefully recognize that each has a very different base - the actual numeric changes involved are perhaps not so dramatic. The next chart simply presents the numeric changes from the peak of teen employment expansion in May 2006 for the Age 16-19, Age 20+ and total U.S. workforce:

Through September 2008, the number of employed teens has shrunk by 697,000 since May 2006. Meanwhile, the number of Age 20+ employed individuals has increased by 1,864,000. Combined, the total employment level of the U.S. has increased by 1,167,000 since May 2006.
That's decrease is particularly remarkable in that the population of employed Age 16-19 individuals is so small compared to the whole of the U.S. workforce. The following chart shows the relative percentage of the Age 16-19 workforce to the whole U.S. employed population:

In May 2006, employed teens represented 4.34% of the workforce. In September 2008, that percentage has fallen to 3.82%.
All in all, it's pretty amazing that such a small group of marginal employees is taking the brunt of job disappearances in the United States. But then, as any economist might tell you, changes at the margins can drive very large effects. The changes to the federal minimum wage are just the latest example of this phenomenon.
Is it any wonder why 2008 Democratic Party presidential nominee Senator Barack Obama is now actively proposing a "face-saving" measure to boost employment levels? One that subsidizes business to try to restore marginal jobs lost due to government-mandated minimum wage hikes without acknowledging their role in drying up the supply of jobs in the job market?
Don't take our word for it. Ask Daniel Hamermesh about it - he helped develop the similarly "targeted program," known as the New Jobs Tax Credit back in 1977. He's quite proud of it and claims great success in directing money collected from taxpayers through Washington D.C. to businesses willing to take on the increased accounting costs to encourage the creation of low wage, low skilled jobs. The kinds of jobs done by teenagers until the minimum wage was increased above its natural equilibrium level.
Sad, really. He, and Senator Obama, should be apologizing instead.
Labels: economics, jobs, minimum wage
Welcome to the blogosphere's toolchest! Here, unlike other blogs dedicated to analyzing current events, we create easy-to-use, simple tools to do the math related to them so you can get in on the action too! If you would like to learn more about these tools, or if you would like to contribute ideas to develop for this blog, please e-mail us at:
ironman at politicalcalculations
Thanks in advance!
Closing values for previous trading day.
This site is primarily powered by:
CSS Validation
RSS Site Feed
JavaScript
The tools on this site are built using JavaScript. If you would like to learn more, one of the best free resources on the web is available at W3Schools.com.