Standard & Poor has once again slashed its outlook for full year dividends per share for the S&P 500. Bloomberg's Lynn Thomasson has the story (HT: Barry Ritholtz):
Dividend payments by companies in the Standard & Poor's 500 Index may plunge 10 percent this quarter, the biggest decline since 1958, as bank failures and slowing economic growth stifle payouts, S&P said.
The firm also cut its estimated 2008 dividend from all S&P 500 companies to $28.05 from $28.85, representing the slowest annual growth since 2001, according to a statement. Financial companies in the index reduced their payouts 35 times in 2008, almost triple the past five years combined, said Howard Silverblatt, the senior index analyst at S&P.
This recent action, which you might think is bad news, may in fact be very good news. It means that we're much closer to the bottom of the stock market than we had anticipated based upon how S&P had previously lowered their forecast for the year's S&P 500's dividends per share. In fact, we'll go so far as to say that we've seen the absolute low for the market already, as measured by the daily closing price of 899.22 for the S&P 500 on 10 October 2008, or by the lowest intraday trading value for the index of 839.80 on the same day.
Update 24 October 2008 (5:45 AM): Or not. It appears that something is developing overseas that will test those lows. We didn't have the information regarding the deteriorating condition of international markets when we originally wrote the previous paragraph and now that their condition is coming into focus, the news will negatively influence the U.S. stock market with the potential to create new intraday and closing 52-week lows.
Update 25 October 2008: Interesting outcome in yesterday's stock market - we have a new daily closing low of 876.77, but not a new intraday low.
However, if we measure (as we do) stock prices by the average of their daily closing prices during each calendar month, we expect stock prices to continue drifting a bit lower from their current level. Through the close of trading on 21 October 2008, the average of the month's closes for October 2008 for the S&P 500 is 997.23.
Our following chart shows how the average monthly value of the S&P 500 has changed with respect to its trailing year dividends per share - note that trailing year dividends are now shifting into reverse, the anticipation of which is the primary factor having pushed the stock market significantly downward during the month of October 2008:

Armed with the latest dividend projection from S&P, combined with more forward looking dividend estimates from indexArb's dividend futures, we can now project that the likely peak of distress for the stock market will occur in January 2009, give or take a month. We would anticipate that the S&P 500 will hit its bottom as we measure it in that same frame of time.
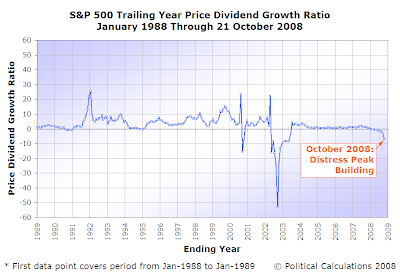
We confirm that a distress peak is building using the data available through 21 October 2008. Here is our chart showing our primary measure of the level of distress in the stock market, the price-dividend growth ratio:

As we've previously noted, peaks of distress in the S&P 500's price-dividend growth ratio often coincide with recessions in the United States and, more importantly for our discussion, market bottoms:

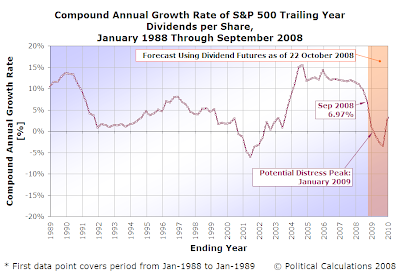
The driving factor in the math behind distress peaks is the compound annual growth rate of trailing year dividends per share. Since this factor is in the denominator of the price-dividend growth ratio, when this value nears a value of zero, the value of the ratio spikes. The next chart shows the future as determined from S&P's latest dividend projection for 2008 combined with indexArb's dividend futures data:

By identifying roughly where the dividend growth rate line crosses the zero growth axis, we can anticipate in which month the peak of distress will occur. With the data available to us today, we observe that is most likely to occur in January 2009, give or take a month.
We'll close by providing Barry's take, explaining why the move to slash their dividends is a sound move for the banks and other publicly traded financial institutions:
For the banks, this is a good thing, They need to hoard their capital, and stop sending $30-40 billion a year off their books.
Hopefully, this explains much of why the annualized growth rate of dividends per share turning negative precedes the turnaround of a declining market. It marks the end of the period in which previous levels of dividends can no longer be sustained and ideally marks the beginning of the period in which the financial strength of the distressed companies within the stock market can be rebuilt on a more sound foundation utilizing this source of additional capital.
That process can take years to play out. Buy and hold, as a money-making investment strategy in these circumstances, is far from dead!
And as a final side note, it's kind of hard to believe that this kind of analysis and the tools we use to do it have only existed since January 2008!
Labels: dividends, forecasting, investing, recession forecast, SP 500, stock market
Welcome to the blogosphere's toolchest! Here, unlike other blogs dedicated to analyzing current events, we create easy-to-use, simple tools to do the math related to them so you can get in on the action too! If you would like to learn more about these tools, or if you would like to contribute ideas to develop for this blog, please e-mail us at:
ironman at politicalcalculations
Thanks in advance!
Closing values for previous trading day.
This site is primarily powered by:
CSS Validation
RSS Site Feed
JavaScript
The tools on this site are built using JavaScript. If you would like to learn more, one of the best free resources on the web is available at W3Schools.com.