Just for fun, we've adapted one of our analytical methods for forecasting stock prices and applied it to the stock market of the Roaring Twenties, which really ran from October 1925 up through September 1929:
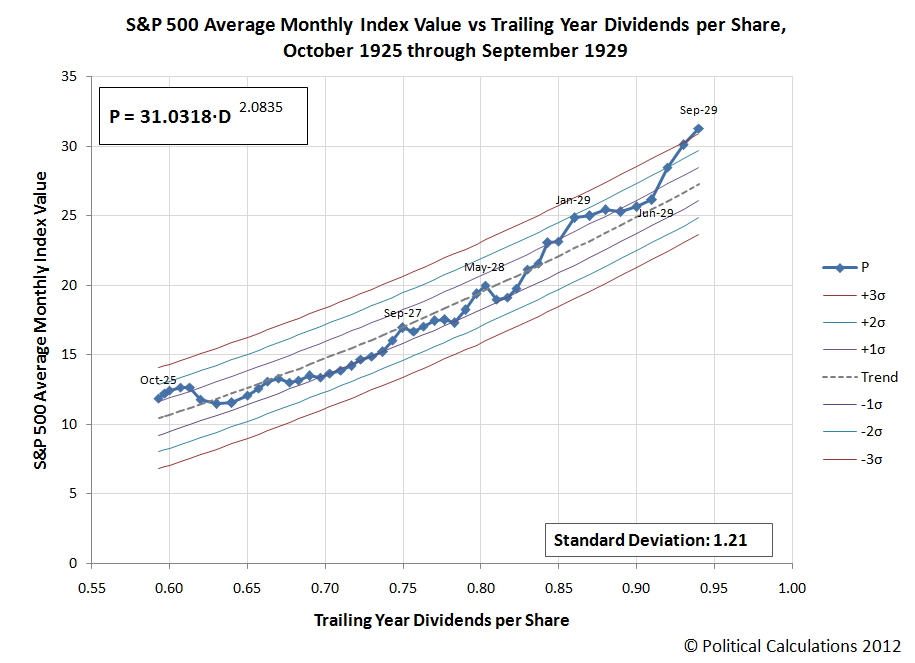
Keeping with our yesteryear analysis by taking only what someone in the 1920s might have known about our statistical control chart-inspired analytical methods into account (statistical control charts were invented by Walter Shewhart in the 1920s, it would still be years before Western Electric's rules for detecting breaks in trends would be well developed), the value of the S&P 500, or really, its predecessor index, in September 1929 would mark a very strong sell signal, indicating that stock prices were no longer "normal", while also being far above the mean.
What followed next in October 1929 is, as they say, history!...

The difference between the upward trajectory for stock prices in the late 1920s and the downward one in the early 1930s is most likely the expectations that investors had for inflation. That difference in trajectory is very similar in many respects to recent stock market history, where the Fed influenced inflationary expectations with its quantitative easing programs. If those expectations had been largely constant throughout this period, the vertical separation between the upward and downward trajectories would likely have been minimal.
And for a different perspective on the history of the Great Crash:
Finally, also just for fun, here's what the present period of comparative order in the stock market looks like today:

Make your own determinations.
Labels: SP 500, stock market
Welcome to the blogosphere's toolchest! Here, unlike other blogs dedicated to analyzing current events, we create easy-to-use, simple tools to do the math related to them so you can get in on the action too! If you would like to learn more about these tools, or if you would like to contribute ideas to develop for this blog, please e-mail us at:
ironman at politicalcalculations
Thanks in advance!
Closing values for previous trading day.
This site is primarily powered by:
CSS Validation

RSS Site Feed
JavaScript
The tools on this site are built using JavaScript. If you would like to learn more, one of the best free resources on the web is available at W3Schools.com.
Other Cool Resources
Blog Roll


