Back in the days of the Soviet Union, there was a whole field within political science known as "Kremlinology", where people outside the ruling circle within the Kremlin would attempt to divine what was really going on in that nation from what little information the country's bosses made public in the media they controlled.
It occurs to us that since we've stopped publicly forecasting where the S&P 500 will go next that many of our readers may be in the same boat. Especially since our last post on the topic, where we posted the following chart and offered this cryptic observation:
An objective reading of the chart indicates two changes affecting stock prices in the relative absence of noise: one in the very near short term as investors adapt to their just changed expectations for dividend payments that has shifted the future from where it was, and the other playing out in the longer term given their overall expectations for the future.
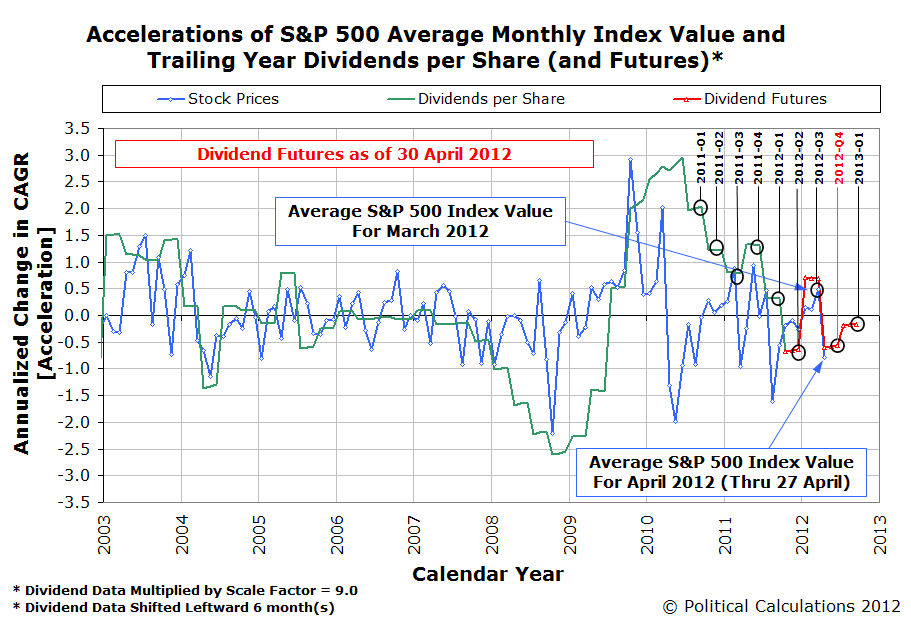
Wow! What the hell did *that* mean?
If you're one of our savvier readers, you would have taken the context of that post into account, where we had begun by noting ExxonMobil's recent increase of their cash dividend payments to become the largest dividend payer in the S&P 500.
Knowing our discovery that changes in the growth rate of stock prices closely track changes in the expected future growth rate of their underlying dividends per share when the stock market in operating in a low-noise environment, you might take our "very near short term" comment as suggesting that with the sudden improvement in the future for dividends, that stock prices would rise in the very near short term.
And you would have been right, although in reality, the S&P 500 had already risen because we were catching up to events that happened on 25 April 2012, when both ExxonMobil and Chevron, both major companies within the market capitalization weighted S&P 500 index, both boosted their dividend payments. From 24 April 2012, the day before the two oil giants' announcements that they would hike their dividends, the S&P 500 had risen from 1371.97 to be 20-35 points higher, peaking at 1405.82 by the end of the trading day following our post.
That's the "very near short term", don't you agree?
But then we went on to consider what would play out with stock prices in the longer term, given the "overall expectations" of investors for the future.
Here, in the "relative absence of noise", which for us, means investor reactions to major news events or say a new round of quantitative easing by the Fed, which are really noisy events that can cause stock prices to greatly deviate from where their dividends per share might otherwise place them, you probably can't help but observe that the expected change in the growth rate for dividends per share in the future is negative. And that's even after the effects of the major dividend increases that had just been announced.
Our sharpest readers then would be able to reasonably see the same future for stock prices that we did, but did not publicly state: after rising in the immediate reaction to the improvement in the future outlook for dividends, stock prices would resume falling, because the improvement in that future outlook wasn't enough to make it positive. Which they have, now having fallen to 1353.39 as of the close of trading on 11 May 2012, well below where they were when the last big dividend increases were announced as part of the first quarter's earnings season!
We'll close our post by showing you exactly what wee see for the future for the S&P 500 today:
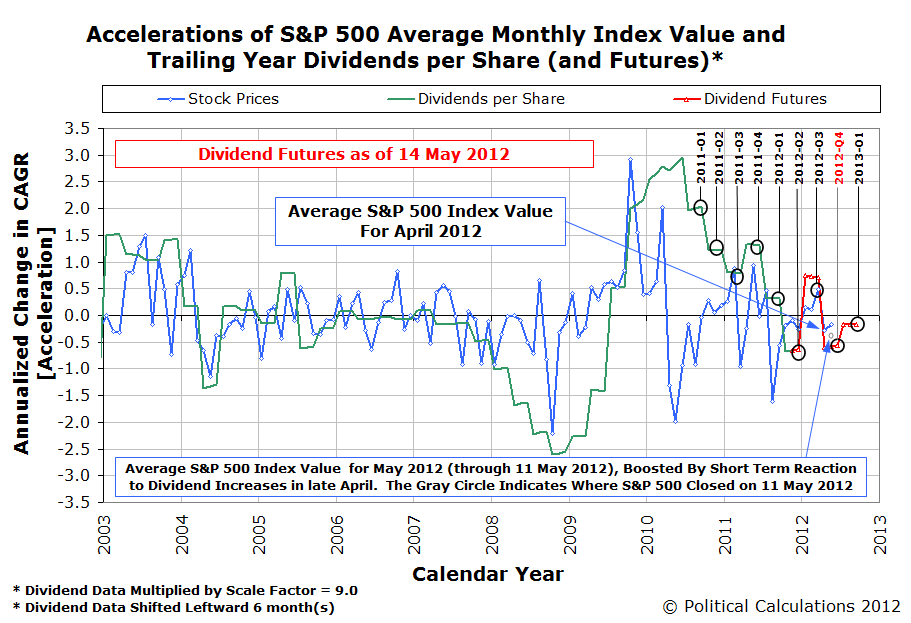
It's up to you now to determine what that means for stock prices. Just remember that as the future changes, so will they!
Labels: chaos, dividends, SP 500
Welcome to the blogosphere's toolchest! Here, unlike other blogs dedicated to analyzing current events, we create easy-to-use, simple tools to do the math related to them so you can get in on the action too! If you would like to learn more about these tools, or if you would like to contribute ideas to develop for this blog, please e-mail us at:
ironman at politicalcalculations
Thanks in advance!
Closing values for previous trading day.
This site is primarily powered by:
CSS Validation

RSS Site Feed
JavaScript
The tools on this site are built using JavaScript. If you would like to learn more, one of the best free resources on the web is available at W3Schools.com.
Other Cool Resources
Blog Roll


