Believe it or not, it has been more than a year since we last provided a forecast for the level of GDP in the U.S. That's mainly because we've focused instead upon developing our model for anticipating where the stock market would go, but with news that the growth rate of real GDP reached 5.7% in the fourth quarter of 2009, we thought it might be fun to go back and fill in the gap for the interim!
What we've done then is to update all our quarterly data for GDP to be expressed in terms of chained 2005 U.S. dollars, to agree with the latest available data from the Bureau of Economic Analysis, and used it to recreate the GDP forecast according to Steve Conover's Climbing Limo method and our own refinement of that method, the Modified Limo.
Both methods utilize the GDP data from previous quarters for their forecasts. The Climbing Limo method then projects where GDP will be three quarters after the most recently concluded quarter, while the Modified Limo only looks forward to the next quarter. In a very real sense, the two Limo methods use the most accurate model of the future U.S. economy possible, the U.S. economy itself from the recent past, and applies the concept of inertia to it, projecting where it will be based upon the path it has been taking.
 Our first chart shows how both methods fared as the U.S. economy went on wild ride from 2008 through 2009. We first observe that the Climbing Limo forecast swings wildly as the economy first turns south, then begins to rebound. This is an expected outcome since the Climbing Limo method projects the level of GDP so far into the future - when the economy is undergoing rapid transitions in going from boom to bust, the Climbing Limo method exaggerates the change.
Meanwhile, we observe that our Modified Limo approach minimizes the extent of much of these wild gyrations. What we see is that the Modified Limo forecast more closely approximates the actual changes taken by the U.S.' GDP.
The table below details the deviations we observe between the Climbing Limo and Modified Limo forecasts and the actual level of GDP recorded by the BEA as a percentage of the actual level of inflation-adjusted GDP. The data for the fourth quarter of 2009 is based on the BEA's advance estimate of GDP for that quarter (the "final" revision of that data will be released in March 2010.)
| Actual Real GDP and Percentage Deviations for the Climbing Limo and Modified Limo Forecasting Methods | |||
|---|---|---|---|
| Year-Quarter | Real GDP [Chained 2005 U.S. Dollars] | "Climbing Limo" Forecast Percentage Deviation | "Modified Limo" Forecast Percentage Deviation |
| 2008-Q4 | 13,141.9 | 2.2% | 1.2% |
| 2009-Q1 | 12,925.4 | 4.1% | 0.6% |
| 2009-Q2 | 12,901.5 | 2.8% | -1.3% |
| 2009-Q3 | 12,973.0 | -1.8% | -1.5% |
| 2009-Q4 | 13,155.0 | -6.1% | -1.2% |
It would seem that our Modified Limo approach does a pretty good job in anticipating where real GDP will really go. So, to make it interesting, we're going to add our GDP forecasts to our list of predictions that we evaluate using our unforgiving plus-minus scoring method. So, for 2009-Q4, we'll anticipate that the final revised figure for real GDP that will be released in March 2010 will be within 2.0% of our predicted value of 12,996.9 billion chained 2005 U.S. dollars.
As for the level of inflation-adjusted GDP in the first quarter of 2010, we'd like to venture that real GDP in 2010-Q1 will be within 2.0% of the 13,284.9 billion chained 2005 U.S. dollars our Modified Limo would forecast based upon the advance release GDP data for 2009-Q4, but we can't as yet.
The reason why goes to the data needed to create the Modified Limo forecast. Here, the Modified Limo method uses the "finalized" data for GDP from the previous quarter to create its forecast, which won't be available for the fourth quarter of 2009 until March 2010. The 13,155.0 billion USD figure currently indicated by the BEA in its advance release is based upon still incomplete information, which makes it subject to change.
Fortunately, the timing on that works out perfectly for us - at the same time when we'll find out if our previous GDP prediction was correct in March 2010, we'll be able to create a new one to replace it!
Labels: gdp, gdp forecast


In between our slew of ongoing projects, we've also taken time to work with our modified method of applying the Climbing Limo approach to the task of forecasting inflation-adjusted GDP for the U.S. in future quarters. The chart below shows some of the preliminary backtesting we've done to see how well our Modified Limo would have fared against where real GDP really came in at:

The main difference between the two methods is how they're applied. The Climbing Limo method is used to forecast real GDP some three quarters ahead in time, while the Modified Limo is only used to forecast where the final revision of real GDP will be in the next quarter. In the chart above, we find that for the next quarter for which GDP data will be released, 2007-Q3, the Modified Limo forecasts a real GDP level of 11,583.3 billion (2000) USD, while the original Climbing Limo method forecast a real GDP level of 11,530.0 billion (2000) USD. Simply projecting the most recent quarter's growth into the next quarter would put this figure at 11,628.6 billion (2000) USD.
Just for fun, we backtested the Modified Limo method using quarterly real GDP data going back to 1947, comparing the forecast results against what simply projecting the previous quarter's rate of growth into the next quarter. In looking at the absolute error (the absolute difference between forecast and actual results), the Modified Limo method produced the following outcomes:
- Beginning with 1948-Q2, the Modified Limo was better than a 1-quarter projection in 59.5% of the quarters since.
- Beginning with 1950-Q1, the Modified Limo was better than a 1-quarter projection in 60.0% of the quarters since.
- Beginning with 1960-Q1, the Modified Limo was better than a 1-quarter projection in 62.1% of the quarters since.
- Beginning with 1970-Q1, the Modified Limo was better than a 1-quarter projection in 64.0% of the quarters since.
- Beginning with 1980-Q1, the Modified Limo was better than a 1-quarter projection in 65.5% of the quarters since.
- Beginning with 1990-Q1, the Modified Limo was better than a 1-quarter projection in 67.1% of the quarters since.
- Beginning with 2000-Q1, the Modified Limo was better than a 1-quarter projection in 76.7% of the quarters since.
We'll know how close we were with our Modified Limo forecast when the final revision for 2007-Q3 is released on December 20, 2007. And yes, when we get around to it, there will be a tool!
Labels: gdp forecast
 Now that GDP data has been finalized for the second quarter of 2008, we can now confirm that First Trust's Brian Wesbury and Bob Stein did an outstanding job in anticipating by several months where economic growth for the quarter would be.
In the change from the preliminary revision to the final revision for 2008Q2's inflation-adjusted GDP growth rate they narrowed the gap between their predicted value and the final figure to overshoot it by just 0.2%, having predicted 3.0% compared to the 2.8% finally recorded in the quarter. By contrast, at the time Wesbury and Stein made their prediction, the consensus among economists was for a growth rate of 2.2%.
And you can count us among those who were way off target from their forecast! Using our preferred forecasting techniques, we way overshot the final figure using the Climbing Limo approach and undershot by a wide but lesser margin using the Modified Limo approach. As a consolation prize however, our modified limo method was more successful, anticipating a Real GDP figure of 11,656.2 billion (in Year 2000 "chained" US dollars), $72.1 billion below the final Real GDP level of $11,727.4 billion recorded for the quarter.
But in these days of $700 billion banking bailout discussions, we suppose that we could call that miss chump change. We just wish we were the chumps with that kind of change! But does that miss mean that our forecasting techniques are toast?
Not necessarily! One of the neat characteristics of the GDP forecasting techniques that we use is that they're self-correcting. Even when they're off by a wide margin, they ultimately get pointed in the right direction and much more often than not, get pretty close to the target - particularly the Modified Limo method which only looks ahead to the next quarter once the data for the previous quarter is finalized. The Climbing Limo approach shows a lot more volatility, which is to be expected from a method that looks three quarters ahead in time.
The chart below tracks where Real GDP has been recorded with respect to where either the Climbing Limo or Modified Limo methods anticipated. We've also projected both forecasts ahead using the most recent finalized GDP quarterly data:

The chart illustrates that we have somewhat of a self-correction convergence coming on between the Climbing Limo and Modified Limo techniques for the level of Real GDP for the third quarter of 2008. The Modified Limo technique anticipates a level of $11,781.4 billion for Real GDP in 2008Q3 vs $11,817.4 billion for the Climbing Limo technique.
Given the current economic climate, we would anticipate that Real GDP will be finalized for 2008Q3 at or a bit below the Modified Limo forecast value of $11,781.4 billion.
No one said fortune telling was an easy business! But it sure is nice for the pundit industry that no one ever seems to remember the huge misses. Former chief economist for the National Association of Realtors David Lereah certainly hopes so!
Labels: gdp forecast

The climbing limo method of forecasting future GDP in the United States projects the nation's economic output in the fourth quarter of 2024 will be approximately $29.6 trillion.
If that number sounds familiar, it's nearly identical to the climbing limo's forecast for 2024-Q3, in which we indicated that quarter's nominal GDP would "be within a few percentage points" of that figure. With the third estimate of GDP now available, we can confirm that forecast was less than one percent off the mark. At $29,374.9 billion, nominal GDP came in below the climbing limo's forecast by 0.8%.
This time around, we think that with the climbing limo forecast nearly unchanged from the previous quarter, the actual nominal GDP figure to be reported by the Bureau of Economic Analysis has a good chance of coming in higher that the climbing limo forecast, similar to what happened in 2024-Q1.
You can judge that likelihood for yourself in the following chart, which tracks the climbing limo method's forecast against the recorded nominal GDP over the past 10 quarters for which GDP data has been finalized outside of annual revisions.

This chart adds the climbing limo's forecast for GDP in 2025-Q2, which at nearly $30.54 trillion, represents a 1.3% increase over the forecast for 2025-Q1.
About the Climbing Limo Forecasting Method
The climbing limo method is a very simple forecasting technique that projects the level of GDP some three quarters into the future using the nominal GDP figures from five quarters and three quarters before that point in time. As such, its forecast represents the momentum of the U.S. economy recorded between the two data points it uses. Deviations between the actual trajectory of GDP and the forecast tells how the momentum of the U.S. economy has changed, which provides useful information even when the differences between forecast and actual values are large.
For example, the biggest deviations it sees typically happen at turning points for the U.S. economy, when it either enters or exits periods of recession. Since 2022-Q3, the forecasts confirm the growth momentum of the U.S. economy has slowed, though it remains on an upward trajectory.
References
U.S. Bureau of Economic Analysis. National Income and Product Accounts. Table 1.1.5. Gross Domestic Product. [Online Database]. Accessed 19 December 2024.
Political Calculations. Forecasting GDP Using the Climbing Limo. [Online Tool]. 10 May 2005.
Image Credit: Microsoft Copilot Designer. Prompt: "A limousine driving up a bumpy, dirt road with the license plate labeled 'GDP'".
Labels: gdp forecast

Later this week, on Thursday, 25 April 2024, the Bureau of Economic Analysis will publish its first estimate of the United States' Gross Domestic Product during the first quarter of 2024.
Because that date is so close, it's a good opportunity to check in with how 2024-Q1's GDP tracks with what a momentum-based forecasting method projected it would be for this quarter over seven months ago. That simple method, called the "Climbing Limo", uses nominal GDP data that was available back in September 2023 in its projections.
The following chart reveals how closely that method worked for anticipating the final GDP estimate for the fourth quarter of 2023 (2023-Q4), which only became available last month. As you can see, there's only a half-percent difference between the forecast for 2023-Q4's nominal GDP and the BEA's official estimate for the quarter.
If the Atlanta Fed's GDPNow forecast for 2024-Q1 is right, this quarter could be the first in which actual GDP exceeds the climbing limo's momentum-based forecast in the period covered by the chart.
Which means nearly nothing. That's because when economic growth is relatively stable, it's common for forecast and actual GDP data series to periodically cross over each other just based on variation in the data. For the period shown on the chart, which presents the Climbing Limo forecast using only the actual GDP data shown on the chart, it has been unusual for actual GDP to have so consistently underperformed the momentum-based forecast.
That could be because inflation, which is built into the nominal GDP estimates, has been slowing over this period. But there are other potential explanations that could account for that pattern as well, including slowing momentum in the U.S. economy after the initial phase of the post-Coronavirus Recession recovery.
Regardless, it will be another two months before we get the BEA's final GDP estimate for the first quarter of 2024 to see how good the Climbing Limo's forecast for 2024-Q1 turned out to be.
Looking much further forward, since the GDP data for 2023-Q4 has been finalized, the Climbing Limo method projection using that data point suggests some rather robust GDP growth through the third quarter of 2024. Unfortunately, it will be months before we find out how good that forecast is. As a general rule of thumb, it's usually within a few percentage points of the actual GDP estimate, but that can change if the economy turns a proverbial corner, either for the better or for the worse. In either of these cases, a comparison with the Climbing Limo forecast provides a useful confirmation of which situation applies.
Update 25 April 2025
The BEA issued its first estimate of nominal GDP for 2024-Q1: $28,284.5 billion. That figure is 0.7% higher than the seven-month old climbing limo forecast of $28,075.4 billion, so reported GDP has crossed above the climbing limo projection. The BEA will finalize its GDP estimate for the quarter, at least outside of its annual revisions, at the end of June 2024. Most news reporting is focusing on the inflation-adjusted "real" GDP figures coming in lower than had been forecast. The first estimate of the real growth rate for 2024-Q1 is 1.6%, the Atlanta Fed's GDPNow forecast tool had antipated 2.7% growth as recently as 24 April 2024.
References
U.S. Bureau of Economic Analysis. National Income and Product Accounts. Table 1.1.5. Gross Domestic Product. [Online Database]. Accessed 21 April 2024.
Political Calculations. Forecasting GDP Using the Climbing Limo. [Online Tool]. 10 May 2005.
Image Credit: Microsoft Copilot Designer. Prompt: "A limousine with the letters 'GDP' driving upward to the top of a hill on a very rocky road, with the limousine driving on the rocks".
Labels: gdp forecast
 We may be on to something. After the Climbing Limo method for forecasting GDP came in way off target for the fourth quarter of 2006 (see inset), we modified the method so that it would incorporate more up-to-date information about the state of U.S. economic growth.
We did this by bridging the most recent actual GDP result with the value forecast by the Climbing Limo method some three quarters out. The following chart shows how this worked with the just finalized GDP data for the first quarter of 2007:

Compared to the actual Real GDP figure of 11,532.8 billion USD, the modified projection of 11,576.3 billion USD turned out to be off by just 0.38%. That's much better than the original forecast of 11,733.0 billion USD, which turned out to be off target by 1.74%.
Our next chart shows the values projected by both the original Climbing Limo method and the Modified Limo for the second quarter of 2007:

The original Climbing Limo method projected a real GDP level for the U.S. economy of 11,636.8 billion USD, while the Modified Limo projects that real GDP will come in at 11,577.9 billion USD in 2007Q2.
Worth reading: Steve Conover's and Brian Wesbury's takes on the future of the U.S. economy.
Update: How embarrassing! We accidentally placed the original two images illustrating the modified Climbing Limo method of forecasting real GDP in place of the two that we intended! The correct versions are now in place....
Labels: forecasting, gdp
 The economic books on 2007 closed today, with the U.S. Bureau of Economic Analysis' final release of GDP data for the fourth quarter of 2007. There was very little change from the advance and preliminary estimates, as all came right around 0.6% for an annualized rate growth over a one-quarter period and 2.7% for an annualized rate of growth over a two-quarter period, so we'll go straight to our GDP bullet charts:

The top GDP bullet chart above shows the annualized growth rates that you'll see in most mainstream media reports, which only considers the rate of economic growth over a one-quarter period, for which the chart depicts the results for the three most recent periods. The bottom GDP bullet chart goes a step further, showing the rates of GDP growth over a two-quarter period of time for the three most recently ended quarters, and therefore, effectively covers the entire past year.
On both charts, these individual data points are illustrated against the backdrop of what's been typical of economic growth in the U.S. since 1980, in the form of the temperature color scale. We can see that on the one-quarter bullet chart, that the fourth quarter of 2007 dipped into the cold end of the chart, while the two-quarter rate of growth falls between the cool (blue) and moderate (green) growth range.
The two-quarter data is especially important as it provides the means by which we can project where GDP will be in the future. The next chart shows our projections using both the Climbing Limo method developed by the Skeptical Optimist, which looks three quarters ahead in time, and our tweaked Modified Limo technique, which only looks ahead toward the next quarter:

With Real GDP coming in at $11,675.7 billion in Year 2000 dollars for the fourth quarter of 2007, we would anticipate that Real GDP for the first quarter of 2008 would come in at the following levels for each of our various forecasting methods:
| Projected Values for Real GDP, 2008-Q1 | |||
|---|---|---|---|
| Forecasting Method | Projected Real GDP [billions 2000 USD] |
One-Quarter Annualized Growth Rate from 2007-Q4 |
Real GDP Data Used to Make Projection |
| One-Quarter Projection (BEA) | 11,672.5 | 0.58% | 2007-Q3 and 2007-Q4 |
| Climbing Limo Projection | 11,709.6 | 1.17% | 2006-Q4 and 2007-Q2 |
| Modified Limo Projection | 11,754.8 | 2.74% | 2007-Q4 and 2008-Q3 (Climbing Limo Projection) |
The data used to create the 2008-Q3 Climbing Limo projection for the Modified Limo technique are the Real GDP figures for 2007-Q2 and 2007-Q4.
Going back to our GDP forecast chart, we note that we see a sharp decline in what the Climbing Limo method would project from 2008-Q2 to 2008-Q3. This effect is driven by a sharp change in recorded GDP levels from previous quarters, which in turn tells us that the one-quarter projection, which we obtain simply by extending the performance of the most recent quarter-over-quarter period one quarter ahead, is likely to be the closest to what the actual figure will be that we should also expect that it will come in below this value.
Given that low value of 0.6%, we would therefore anticipate that Real GDP will be between 0.0 and 0.6%.
It might not be a recession, but there's no denying that economic growth in the U.S. is dragging.
Labels: gdp forecast
It may surprise you, but since we first introduced the "Modified Limo" method for forecasting what GDP will be a quarter ahead of time, we've never gotten around to making a tool that you can use to do our math!
Today, we're fixing that problem and doing just that! To use our tool with U.S. data, you'll need to get three pieces of data from the Bureau of Economic Analysis, which you'll find in Table 3 of the most recent GDP data release the agency has issued:

Here, you'll be specifically interested in three values: the real GDP data for the three most recently completed quarters, which is what we've circled in the excerpted image above for the most recent report which, at this writing, shows the advance estimate of U.S. inflation-adjusted GDP through the first quarter of 2011.
Next, enter that data into the tool below. And then click the "Calculate" button. Really! That's all you need to do, because forecasting GDP is that easy!
Using our default data, which coincides with the BEA's third estimates for inflation-adjusted GDP in the U.S. for the second, third and fourth quarters of 2010, our "modified limo" method would anticipate that real GDP in the next quarter, 2011Q1, will be $13,475.2 billion chained 2005 U.S. dollars. As you can see from the BEA's advance estimate for the first quarter of 2011, that's really close to their number of $13,438.8 billion.
The real comparison however will be when the BEA releases its third estimate of GDP for the first quarter of 2011, which as of this writing, will occur on 24 June 2011.
Notes
While our math is built using the finalized estimates for each quarter's GDP recorded by the BEA, it can be used with the BEA's advance and preliminary estimates to get a sense of where GDP will be in two quarters time. Because these estimates can change however, you should expect that those future projections will change as well.
Our "modified limo" method is least accurate when the economy is effectively "going around a corner". By that, we mean when the economy begins to worsen after a period of growth or when the economy begins to improve after a downturn, which you can see in our chart showing GDP data since 2002 below:

You can also see in the chart above that over time, the "modified limo" technique is self-correcting. Even if it goes off target, it will eventually go back to be either on target or nearly so. Generally speaking, the "modified limo" estimate will almost always be within two percent of the actually recorded value.
The "modified limo" method works because of the "inertial" nature of GDP - it tends to follow a trajectory defined by a simple linear function of time. Ivan Kitov has a neat discussion of the data supporting that contention in 1000 Arguments Against the Solow Growth Model.
Labels: forecasting, gdp, gdp forecast, tool
The strongest force affecting future GDP is inertia.
At least, it is if you go by our "modified limo" approach to forecasting future GDP!
Here, we took a forecasting approach originally developed by Steve Conover, which he called the "climbing limo" method, and adapted it to produce a more accurate projection of GDP in the near term (the next quarter) than what the climbing limo method delivers (although to be fair, the climbing limo method was developed to look three quarters into the future - there's a lot that can happen in the meantime to sway the economy off the course that method would forecast!)
Now that the GDP data for the second quarter of 2011 has been finalized, we can now project where real GDP will be in 2011-Q3, using the tool we developed to forecast the next quarter's GDP!
The graph below visualizes the forecast presented by our tool:

In reality, the target value of $13,299.8 billion in constant 2005 U.S. dollars that we've projected for the inflation-adjusted value of GDP in the third quarter of 2011 represents the midpoint of the forecast range into which we expect GDP to be in 2011-Q3.
Assuming that the deviation between our modified limo forecast value and actual GDP can be described by a normal distribution, we estimate a 68.2% probability of the BEA recording real GDP for 2011-Q3 somewhere between $13,160.1 billion and $13,439.5 billion, and a 95% probability of it falling between $13,020.4 billion and $13,579.2 billion. There is a 99.7% probability of 2011-Q3's GDP figure being recorded somewhere between $12,880.8 billion and $13,718.8 billion.
The midpoint value of our forecast range for the third quarter of 2011 would represent a 0.8% annualized rate of growth for the U.S. economy. We would describe that level of growth as near-recessionary, if not recessionary. Or as we might better describe it, given the data we have today, the odds are that U.S. will continue to experience what might best be described as a microrecession. But then, such is the nature of inertia.
We'll finally note that there is a 50% chance the U.S. economy is currently performing better than this forecast figure would anticipate and a 50% chance it's currently performing worse. We'll find out which is the case on 27 October 2011.
Labels: gdp forecast, tool
When we originally developed our two-quarter GDP bullet thermometer chart as a visual tool that we could use to better describe the overall health of the U.S. economy, we did so to address a deficiency that Bill Polley observed in the traditional definition of a recession as being a two-quarter period of negative GDP growth: those times when the GDP number bounces back and forth across the zero line between positive and negative territory.
Since our primary metric for GDP is the economic growth rate annualized over the previous two-quarter period, we automatically account for that situation. Using this two-quarter GDP growth rate, we can much more easily identify recessionary periods using just GDP data.
Then we went a step beyond that. We also incorporated David Tufte's GDP "grading scale" into our bullet chart visualization, which appears as the temperature scale gradients, but we did so in a way that would blend the transitions between otherwise distinct boundaries in that scale.
This blending effect allows us to account for something that's often missed in GDP reporting: the margin of error. We recognize that GDP figures are subject to revision, first in moving from the advance release for a given quarter, through the next preliminary release and then onto a "final" revision. And then, perhaps months or years later, the "final" revision for a quarter is perhaps revised again, as more economic data about the time becomes known. This blending allows for us to anticipate any potential downward revisions.
Today's advance release of GDP for the first quarter of 2008 (available in this PDF document) indicates that the U.S. economy is essentially on the edge of being in recession. With the two-quarter annualized GDP growth rate at 0.6%, it falls directly in the transition range between the "cold" purple zone indicating recession and the "cool" blue zone indicating slow growth:

Eerily, at 0.6%, the GDP growth rate for 2008Q1 comes in right where both the Climbing Limo GDP forecasting method and our Modified Limo forecasting method would have placed it. The following chart shows where the advance release figure for 2008Q1 would be along with where both the Climbing and Modified Limo projection techniques anticipated it, along with the latest forecasts for each:

We would anticipate that the GDP figure for the second quarter of 2008 will come in between the forecast values for each of our Limo methods, however given the sharp rise and decline of the Climbing Limo forecast (which indicates changes in economic momentum), we would expect it to much more closely track the value for the Modified Limo forecast. At best, that would indicate that the U.S. economy is moving through a very slow growth period, edging the boundary of recession.
Bear in mind however that we will be revising this forecast twice more, as the 2008Q1 GDP data goes through it's preliminary and final revisions.
The 2008Q1 GDP Data Commented Upon Elsewhere
Greg Mankiw sees the glass half full and notes that Intrade's odds of recession in 2008 have dropped to 25% (although to be fair, the Intrade bet is whether there will be two consecutive quarters of negative growth!)
Barry Ritholtz is out of pocket at this writing, but will have comment soon, with a special focus upon corporate profits, the PCE inflation measure and seasonal adjustments.
Mark Perry makes the no recession call (yes, we hope he's ultimately right!)
Tom Blumer notes that the Democrats will have to put off their glee at being able to blame Bush for negative economic growth for at least another quarter.
Jim Hamilton has updated his Recession Indicator Index, which ticked up to 26.9% with the latest data. A reading of 65% is needed to anticipate the NBER's decision to declare 2008Q1 to have been in recession.
Bill Polley touches on the GDP report in providing an essential review of the Fed's action today, and also can claim bragging rights since his class correctly anticipated the Fed's action!
Finally, the WSJ surveys a number of institutional economists on their views of whether the economy is indeed in recession.
Labels: gdp, gdp forecast

Later this week, on Thursday, 25 July 2024, the Bureau of Economic Analysis will publish its first estimate of the United States' Gross Domestic Product during the second quarter of 2024.
With that date just a day away, it's a good time to check in with how 2024-Q2's GDP tracks with what a momentum-based forecasting method projected it would be for this quarter over seven months ago. That simple method, called the "Climbing Limo", uses nominal GDP data that was available back in December 2023 in its projections.
As you can see in the following chart, that method came within one percent of anticipating the final GDP estimate for the first quarter of 2024 (2024-Q1), the data for which only became available last month.

Coincidentally, the Atlanta Fed's GDPNow forecast for 2024-Q1 was correct in projecting 2024-Q1's actual GDP exceeded the climbing limo's momentum-based forecast for this period.
Looking forward, since the GDP data for 2024-Q1 has been finalized, the Climbing Limo projection of GDP built using that data point suggests the United States' nominal GDP is on track to rise through the end of 2024 at a steady pace.
Update 25 July 2024
The BEA's first estimate of nominal GDP for 2024-Q2 is $28,629.2 billion (nominal = not adjusted for inflation). That figure is 0.8% below the Climbing Limo's forecast of $28,849.4 billion for 2024-Q2, as the U.S. economy would appear to be returning to underperforming the forecasting method's projection of where it would be based on its previous momentum.
References
U.S. Bureau of Economic Analysis. National Income and Product Accounts. Table 1.1.5. Gross Domestic Product. [Online Database]. Accessed 27 June 2024.
Political Calculations. Forecasting GDP Using the Climbing Limo. [Online Tool]. 10 May 2005.
Image Credit: Microsoft Copilot Designer. Prompt: "A simple sketch of a limousine driving uphill toward the right side of a rising zig zag line chart".
Labels: gdp forecast
The climbing limo method of forecasting future GDP in the United States projects the nation's economic output in the recently finished first quarter of 2026 will be around $31.5 trillion.
This estimate assumes the momentum the U.S. economy recorded in growing between 2024-Q4 and 2025-Q2 will be sustained through the recently ended quarter of 2026-Q1. Since the U.S. economy's momentum has come in stronger than expected over the intervening quarters since our last snapshot, it's likely 2026-Q1's will come in above that value, which is not adjusted for inflation.
These projections have been delayed because the Senate Democrats' government shutdown disrupted U.S. economic data reporting. It took until earlier this month to get finalized GDP data for both 2025-Q3 and Q4, which means we can now generate the climbing limo method's momentum-based projections for both 2026-Q2 and 2026-Q3. The following chart visually presents those projections while showing how actual non-inflation adjusted GDP tracked with the model's previous projections:

For the now current quarter of 2026-Q2, the climbing limo GDP forecasting method projects GDP will potentially rise to almost $32.8 trillion. Since that projection was generated with finalized GDP figures for 2025-Q1 and 2025-Q3, long before any impact from the Iran war would be felt, it will be interesting to see how well that forecast tracks with 2026-Q2's actual GDP.
That's because the climbing limo forecasting method is a momentum-based projection. As such, even when recorded GDP deviates considerably from the forecast values that are projected three quarters ahead in time, it provides valuable information in confirming the economy's underlying momentum has changed. We should get a good reading on how big the Iran war's impact has been on the U.S. economy after the actual GDP data for 2026-Q2 is reported.
Meanwhile, the most distant future projection we can make with available finalized GDP data is for 2026-Q3, where the climbing limo forecasting method anticipates the nation's nominal GDP will rise to about $32.9 trillion.
References
U.S. Bureau of Economic Analysis. National Income and Product Accounts. Table 1.1.5. Gross Domestic Product. [Online Database]. Accessed 9 April 2026.
Image Credit: Microsoft Copilot Designer. Prompt: "A simple sketch of a limousine driving uphill toward the right side of a rising zig zag line chart".
Labels: gdp forecast

The climbing limo method of forecasting future GDP in the United States projects the nation's economic output in the third quarter of 2024 will be within a few percentage points of $29.6 trillion.
The U.S. Bureau of Economic analysis released a pretty extensive set of revisions for its GDP data going back to January 2019, which changed the climbing limo's forecast for what non-inflation adjusted GDP will be in 2024-Q3. The new forecast is nearly one percent higher than the original forecast for the quarter.
The climbing limo's latest projections based on the revised data can be seen in the following chart, which also adds the first projection for how large the non-inflation adjusted economy will be in 2025-Q1.

The climbing limo method is a very simple forecasting technique that projects the level of GDP some three quarters into the future using the nominal GDP figures from five quarters and three quarters before that point in time. As such, its forecast represents the momentum of the U.S. economy recorded between the two data points it uses. Deviations between the actual trajectory of GDP and the forecast tells how the momentum of the U.S. economy has changed, which provides useful information even when the differences between forecast and actual values are large.
References
U.S. Bureau of Economic Analysis. National Income and Product Accounts. Table 1.1.5. Gross Domestic Product. [Online Database]. Accessed 4 October 2024.
Political Calculations. Forecasting GDP Using the Climbing Limo. [Online Tool]. 10 May 2005.
Image Credit: Microsoft Copilot Designer. Prompt: "A simple sketch of a limousine driving uphill toward the right side of a rising zig zag line chart".
Labels: gdp forecast

The climbing limo method of forecasting future GDP in the United States projects the nation's economic output in the recently finished third quarter of 2025 will be around $30.9 trillion.
This estimate assumes the momentum the U.S. economy recorded in growing between 2024-Q2 and 2024-Q4 will be sustained through the current quarter. Since the U.S. economy's momentum has been slowing however, it's likely 2025-Q3's will come in below that value, which is not adjusted for inflation.
That's the same scenario we anticipated for 2025-Q2's finalized GDP estimate, which the following chart indicates held even as the BEA revised all the GDP data used to create the climbing limo forecasts.

Because the BEA revised all its GDP data going back to the first quarter of 2020, this chart shows the climbing limo GDP forecasts as if that data had been available throughout the period it covers.
Generally speaking, the BEA revised its nominal GDP data for all quarters from 2020-Q1 through 2025-Q1 upward by varying amounts, with the largest adjustments in the period from 2023-Q3 through 2025-Q1.
Looking at the recently released estimate for 2025-Q2, the climbing limo method had forecast GDP would clock in at about $30.58 trillion, which after the BEA's revisions, is now shown as nearly $30.76 trillion. The BEA's now official estimate of GDP for this quarter is $30.49 trillion. The official estimate came in lower than both the original and revised forecasts.
The climbing limo forecasting method is a "momentum"-based projection. As such, even when recorded GDP deviates considerably from the forecast values that are projected three quarters ahead in time, it provides valuable information in confirming the economy's underlying momentum has changed. For much of the period the chart shows, it confirms the U.S. economy's growth momentum has been slowing since its initial recovery from 2020's Coronavirus Pandemic Recession.
References
U.S. Bureau of Economic Analysis. National Income and Product Accounts. Table 1.1.5. Gross Domestic Product. [Online Database]. Accessed 26 September 2025.
Image Credit: Microsoft Copilot Designer. Prompt: "Image of a long limousine driving up a bumpy area chart labeled 'GDP'".
Labels: gdp forecast

The climbing limo method of forecasting future GDP in the United States projects the nation's economic output in the first quarter of 2025 will be around $30.1 trillion.
This estimate assumes the momentum the U.S. economy recorded in growing between 2023-Q4 and 2024-Q2 will be sustained through the current quarter. That assumption is unlikely to hold however considering how 2025 has been unfolding.
There are lots of moving pieces affecting the growth trajectory of the U.S. economy, most of which were set in motion long before the quarter began. As such, it's quite possible the climbing limo forecast will be wrong. Which, believe it or not, is not a bad thing.
Here's why. The climbing limo method is a very simple forecasting technique that projects the level of GDP some three quarters into the future using the nominal GDP figures from five quarters and three quarters before that point in time. Its forecasts therefore represent the momentum of the U.S. economy recorded between the two data points it uses. Deviations between the actual trajectory of GDP and the forecast tells how the momentum of the U.S. economy has changed, which provides useful information even when the differences between forecast and actual values are large.
For example, the biggest deviations it sees typically happen at turning points for the U.S. economy, when it either enters or exits periods of recession. 2025-Q1 may be on the cusp of such a change.
We'll get the first estimates of 2025-Q1 actual GDP trajectory at the end of April 2025. Until then, the following chart shows the climbing limo method's forecast against the recorded nominal GDP over the past 11 quarters for which GDP data has been finalized outside of annual revisions.

Most GDP forecasts are projecting slower growth in 2025-Q1, with some anticipating negative growth at this writing. And that's without any impact from the global tariff war that erupted on 2 April 2025, which falls in 2025-Q2. How big do you suppose the deviation will be?
References
U.S. Bureau of Economic Analysis. National Income and Product Accounts. Table 1.1.5. Gross Domestic Product. [Online Database]. Accessed 6 April 2025.
Political Calculations. Forecasting GDP Using the Climbing Limo. [Online Tool]. 10 May 2005.
Image Credit: Microsoft Copilot Designer. Prompt: "A limousine navigating an uphill, rocky road".
Labels: gdp forecast

The climbing limo method of forecasting future GDP in the United States projects the nation's economic output in the recently finished second quarter of 2025 will be around $30.5 trillion.
This estimate assumes the momentum the U.S. economy recorded in growing between 2024-Q1 and 2024-Q3 will be sustained through the current quarter. Unfortunately, the U.S. economy's momentum has been slowing, which suggests GDP for 2025-Q2 will come in below that estimate.
Speaking of which, that exact scenario played in the first quarter of 2025, which we can confirm with the third estimate of that quarter's GDP that was reported on 26 June 2025. The climbing limo method had forecast the economy would U.S. grow $30.1 trillion in nominal, non-inflation adjusted terms, which we projected three quarters ago. The actual figure came in at $30.0 trillion, which is not far off from that projection, but still undershoots it. This outcome confirms the nation's nominal economic growth has slowed.
We're citing these figures as if they're fully fixed, but they are still subject to annual revisions. The Bureau of Economic Statistics typically performs an annual revision for its GDP data sometime during the third quarter of each year, most often in July. When it does, we'll regenerate all the climbing limo forecasts based on how the official data changes.
Until then, the following chart shows the climbing limo method's forecast against the recorded nominal GDP over the past 12 quarters for which GDP data has been finalized outside of the BEA's annual revisions.

Regardless of revisions, the GDP data for 2025-Q2 will be something to watch because of the global tariff war that erupted on 2 April 2025 at the start of the quarter. The tariff war may have something of a wild card effect on the U.S. economy's growth trajectory, hinging on multiple factors that have been playing out within the economy during the last few months.
References
U.S. Bureau of Economic Analysis. National Income and Product Accounts. Table 1.1.5. Gross Domestic Product. [Online Database]. Accessed 26 June 2025.
Political Calculations. Forecasting GDP Using the Climbing Limo. [Online Tool]. 10 May 2005.
Image Credit: Microsoft Copilot Designer. Prompt: "A long limousine driving up a bumpy chart showing GDP growth".
Labels: gdp forecast

Momentum. If you ever wondered what the single biggest factor that sets the trajectory of economic growth is, that's the answer. It's momentum.
For example, let's say you wanted to predict how big the U.S. economy would grow to be over the next few quarters, but you didn't know anything more than what the nation's GDP was during the last few quarters. More often than not, that's enough information to put you within a few percent of the actual GDP result. Even when the projection is off by more than that, it still tells you something useful about how the economy is performing.
That's the thinking behind the "Climbing Limo" forecasting method, which is a very simple approach to reasonably project what to expect for GDP. Here's how it works. Start with the most recently finalized quarterly GDP data you have available and the GDP recorded two quarters before that and draw them on a chart with GDP on the vertical axis and quarters on the horizontal. You would next connect those dots with a straight line, then extend that line three quarters into the future to draw a new dot at the end of that line. That's your forecast for that future quarter.
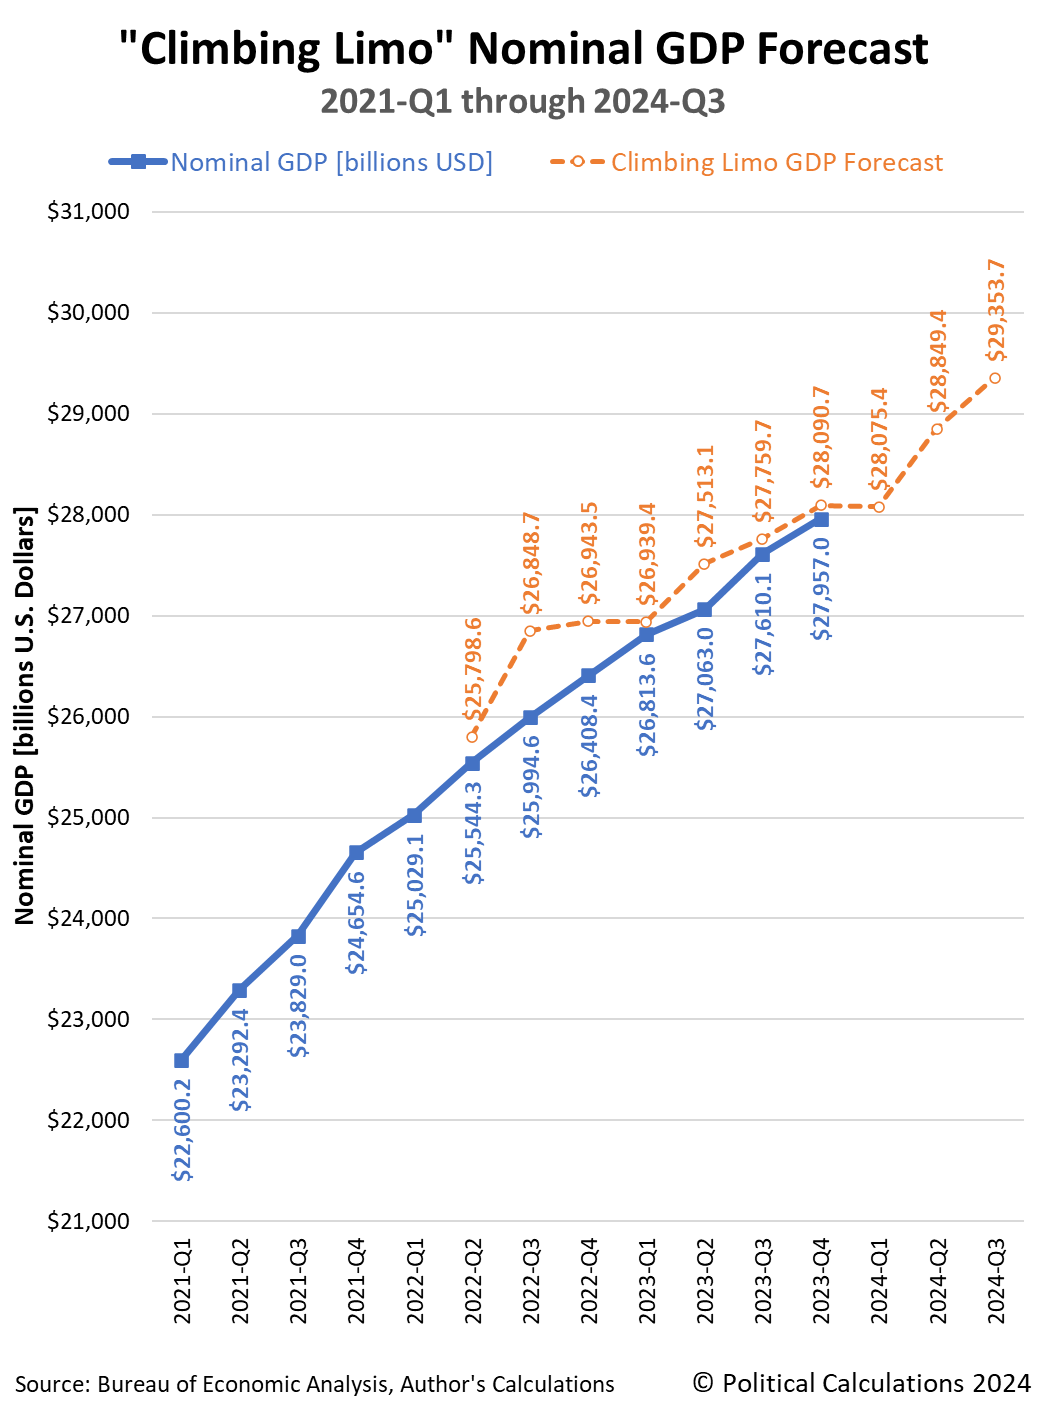
We've done that exercise in the following chart with the available GDP data for the period running from the first quarter of 2021 through the third quarter of 2023. In the chart, the blue solid line represents that actual nominal GDP data, while the orange dashed line represents the forecasted GDP, which starts at the second quarter of 2022 and run through the second quarter of 2024.

All but one of the forecast values on this chart are within three percent of the actual quarterly result after it was finalized in the Bureau of Economic Analysis' third estimate a few months after the quarter ended. As you can see, some forecast results are very close to the officially recorded finalized value.
The largest deviation between forecast and actual GDP is for the second quarter of 2022 (2022-Q2), where the forecast value is 3.3% higher than the actual value. That forecast is based on the actual GDP datapoints for 2021-Q1 and 2021-Q3 and represents how much larger GDP could have been if economic growth sustained the momentum it recorded between these two quarters.
That it isn't tells us something changed between 2021-Q3 and 2022-Q3 to affect the growth path for the U.S. economy. That's the kind of useful information we can extract from the chart whenever we see the deviation between forecast and actual data gets larger than a three percent threshold. It often signals a turning point.
In this case, 2022-Q3 represents when the Federal Reserve's actions to increase interest rates to combat the inflation unleashed in the U.S. economy between 2021-Q1 and 2021-Q3 started making their presence felt as a change in momentum for GDP.
The chart is unusual in that all the forecast values have run higher than the actual GDP figures. When we've done similar exercises in the past, we've typically seen the two data series cross over each other, with the data points well within that three percentage point margin. That pattern is what you would expect during periods when economic growth momentum is relatively consistent.
But instead of that pattern, the chart shows the period between 2022-Q2 and 2023-Q3 has been one in which the U.S. economy has experienced fading momentum.
The first estimate for GDP during the fourth quarter of 2023 will be released on Thursday, 25 January 2024. While not the final value, where it falls with respect to the forecast will give an idea of whether that fading momentum pattern continued through the end of 2023. We timed this article so you wouldn't have to wait long to find out. The references below will take you to where you can access the data you need and our climbing limo tool where you can do the math for yourself.
Update 26 January 2024
The first estimate of the United States' GDP in 2023-Q4 is now available, with nominal GDP being initially reported at $27,938.8 billion, which is 0.5% below the climbing limo estimate. The nominal GDP estimate for this quarter will be revised twice more before it is relatively finalized (outside of annual revisions) in March 2024. The climbing limo estimate for 2023-Q4 is based on the non-inflation adjusted GDP figures reported for 2022-Q3 and 2023-Q1.
References
U.S. Bureau of Economic Analysis. National Income and Product Accounts. Table 1.1.5. Gross Domestic Product. [Online Database]. Accessed 20 January 2024.
Political Calculations. Forecasting GDP Using the Climbing Limo. [Online Tool]. 10 May 2005.
Image credit: Microsoft Bing Image Creator. Prompt: "The side view of a limousine driving on bumpy rocks, highly detailed, 4k, award winning automobile magazine photography."
Labels: gdp forecast
Welcome to the blogosphere's toolchest! Here, unlike other blogs dedicated to analyzing current events, we create easy-to-use, simple tools to do the math related to them so you can get in on the action too! If you would like to learn more about these tools, or if you would like to contribute ideas to develop for this blog, please e-mail us at:
ironman at politicalcalculations
Thanks in advance!
Closing values for previous trading day.
This site is primarily powered by:

CSS Validation

RSS Site Feed

JavaScript
The tools on this site are built using JavaScript. If you would like to learn more, one of the best free resources on the web is available at W3Schools.com.
Other Cool Resources
Blog Roll


