With stock prices rallying strongly today, we thought we'd take the opportunity to consider where the money that's going into stocks today is originating. Reuters' Matthew Goldstein reports (as of 12:18 PM EDT):
NEW YORK (Reuters) - The S&P 500 and Nasdaq both jumped 1 percent on Wednesday as increased industrial production and a pickup in mergers and acquisitions reinforced hopes the economy was gaining speed.
Commodity prices rose, with gold hitting an 18-month high, and boosted natural resource companies like Freeport-McMoran Copper & Gold Inc (FCX.N), up 1.6 percent to $72.49.
Software maker Adobe Systems Inc said it will buy Omniture, a company that makes software to analyze Web traffic, in a bid to boost sagging sales.
Industrial output advanced for a second consecutive month in August, while higher gasoline costs pushed up consumer prices, although economists said the risk of inflation remained low.
 The increase industrial output is a nice and welcome change, but in our view, it is not a market driving change at this point in time.
Meanwhile, we also reject the "increase" in mergers and acquisition (M&A) activity as a serious source of upward market momentum because of the companies involved. Adobe Systems is #118 when it comes to market capitalization weighting in the S&P 500, while Omniture isn't big enough to even make it into the list. A change in Adobe's stock price could affect the value of the the overall index, but not by very much and, as Goldstein observes, its stock price went down. Consequently, we find that particular news isn't behind today's rise in stock prices.
On the third count, Goldstein reports that gold, commodity and gasoline prices are up, as are their related stocks, but that inflation risks are low. That suggests that the U.S. dollar has lost some more value. Good for industrial output, as U.S. produced goods become more competitive in the global market, but as we noted earlier, that factor is not a huge market driving change.
Looking at the component stocks of the Dow Jones Industrial index today, we find that index' two oil companies, Exxon Mobil (#1 in market cap for the S&P 500) and Chevron (#11), are only seeing their stock rise in value by roughly 1.25% (at this writing). But we see that other large companies are seeing their stock prices rise by much larger percentages, such as General Electric (#3) by 6%, JP Morgan Chase (#4) by 3%, while Microsoft and Johnson and Johnson are nearly flat, to round out the significant changes in the top 5 weighted stocks in the S&P 500. Exxon's increase alone could move the index a lot, but not as much as it has moved thanks to the other stocks. Something else is going on....
What Else Is Going On?
Not mentioned in Goldstein's reporting are two huge developments - one that has an expiration date and one that doesn't. Let's get to the one that doesn't first....
Yesterday, very big news came out from JP Morgan Chase, as CFO Mike Cavanagh announced that the bank would likely increase its dividend in 2010:
JPMorgan Chase & Co. (JPM) may increase its dividend next year and stop adding to reserves sooner, if the economy continues to recover, Chief Financial Officer Mike Cavanagh said Tuesday.
"We're going to be looking for evidence we're not double-dipping," Cavanagh said during a presentation to analysts and investors in New York. Such evidence will include "unemployment peaking and coming down" and net charge-offs on loans falling, he added.
Once that happens, JPMorgan will likely make a "significant step in the dividend in one shot," lifting the annual payout to between 75 cents and $1 a share, from the current 20 cents a share, Cavanagh explained.
That could happen as soon as early 2010, depending on the economy, he said.
 Factoring in the market's weighting of JP Morgan Chase in the S&P 500, this news lifted the expected future growth rate of dividends per share for the entire index by 1.7 cents per quarter. We believe that change, combined with speculation that other financial institutions that have been in the TARP doghouse for the past year may soon follow suit is likely responsible for a good portion of the stock market's rise today, which we can confirm by observing that the financial stocks of the DJI are all up more than 2% today. /p>
But not all. Even with this change in the expected future growth rate of the S&P 500's dividends per share, we find that stock prices would, at most, average somewhere between a level of 1005 at the low end (based on an amplification factor of 6.5 in our method of projecting the value of stocks) and 1037 at the upper end (based on an amplification factor of 11.0.) These amplification factors correspond to our observations of the U.S. stock market since January 2001.
Money Off the Sidelines
Our working theory is that stock prices are being boosted by additional money is coming off the metaphorical sidelines. Not from investors who haven't been investing, but rather from major traders who fled the stock market a year ago and parked the money that they took out in U.S. Treasuries.

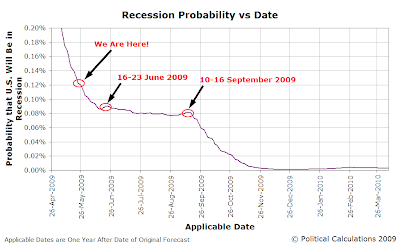
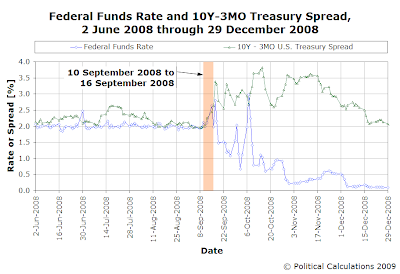
Since our preferred recession prediction model incorporates data related to the U.S. Federal Reserve's Federal Funds Rate and the spread between 10-Year and 3-Month U.S. Constant Maturity Treasuries, most of the changes we've observed in seeing a sudden reversal of the resulting recession probability were correlated with a sudden narrowing of the U.S. Treasury yield spread.
We believe that these events were, after a year's time, reflected in the U.S. stock market by suddenly declining stock prices. Here, we believe that bond market traders used stock options and stock purchases as part of a hedging strategy against the potential inflation risk implied by the flattening of the U.S. Treasury yield curve. After a year's time, as the options contracts and bond redemption holding period restrictions expired, this hedging strategy results in a larger than average number of shares coming in to be sold in the stock market.

Instead of being the result of a sudden flattening or inverting of the U.S. Treasury yield curve, this period was defined by a dramatic widening of the U.S. Treasury yield spread. And with it clear that the flow of money effectively being reversed, we anticipated that stocks would rise substantially during this period, as a good portion of the substantial amount of money taken out of stocks and stashed in one-year U.S. Treasuries for safekeeping during the fiscal crisis of September 2008 is now free to reenter the stock market.
From our perspective, it's still a noise-driven event, which will have an expiration date. With prices having risen well above the range that their fundamental drivers of value would place them, we consider it to be a selling opportunity.
Update 17 September 2009: Barry Ritholtz posts commentary by James Bianco that suggests that we're very much on the right track with our analysis.
Labels: forecasting, stock market
Welcome to the blogosphere's toolchest! Here, unlike other blogs dedicated to analyzing current events, we create easy-to-use, simple tools to do the math related to them so you can get in on the action too! If you would like to learn more about these tools, or if you would like to contribute ideas to develop for this blog, please e-mail us at:
ironman at politicalcalculations
Thanks in advance!
Closing values for previous trading day.
This site is primarily powered by:
CSS Validation
RSS Site Feed
JavaScript
The tools on this site are built using JavaScript. If you would like to learn more, one of the best free resources on the web is available at W3Schools.com.