After offering our own updated GDP forecast for the second and third quarters of 2012 earlier this morning, we were looking over the White House's 27 July 2012 Mid-Session Review for the budget of the U.S. government, and specifically at Table 2, where the White House forecasts that the average GDP growth rate for the calendar year of 2012 will be 2.6%.
Taking into account that the annualized GDP growth rate for the first quarter of 2012 was just recorded on the same date of 27 July 2012 to be 2.0% and that the first indication for the real growth rate of GDP in the second quarter was 1.5%, to hit that 2.6% mark, the White House apparently believes that economic growth in the U.S. will surge to reach an average annualized growth rate of 3.5% in both the third and fourth quarters of 2012.
Since we're now one month into the third quarter of 2012, clearly, this means that the White House believes that happy days are here again!
Labels: gdp forecast, satire
Since the U.S. Bureau of Economic Analysis revised the data we use to project future GDP for the U.S., we're updating our forecast accordingly from what we had previously posted:
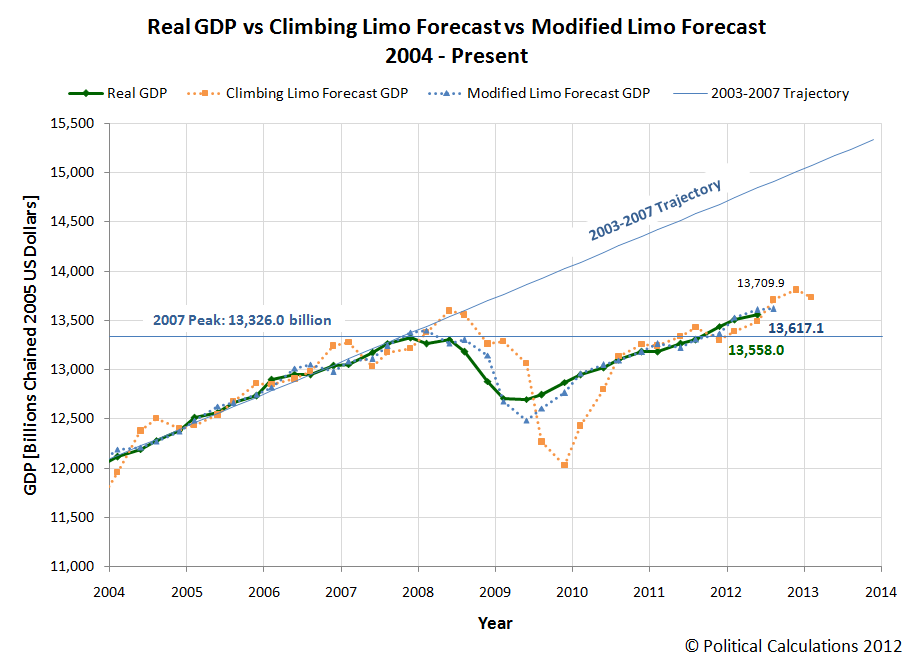
Going by our preferred Modified Limo forecasting technique, we now see a 50% probability that real GDP in 2012-Q2 will be finalized at a value over $13,608.0 billion, and a 50% probability that it will be finalized under that level.
The BEA's first advance estimate for the quarter is $13,558.0 billion, so at present, it appears that we overshot the target by 0.37%, although we are still within our originally projected forecast range (where we had given a 68.2% probability of that 2012-Q2 real GDP would fall between $13,367.7 billion and $13,649.9 billion in terms of constant 2005 U.S. dollars.
Peeking ahead, using the BEA's first estimate of 2012-Q2's GDP (they will "finalize" the estimate for the quarter with their third estimate in September 2012), we would project real GDP in 2012-Q3 to be roughly $13,617.1 billion in the inflation-adjusted terms of chained 2005 U.S. dollars, with a 68.2% probability of falling between $13,475.3 billion and $13,758.9 billion.
All-in-all, that suggests a pretty lackluster GDP growth rate is in store for the third quarter of 2012.
Labels: gdp forecast
On Friday, 27 July 2012, the Bureau of Economic Analysis revised its estimates of the U.S.' inflation-adjusted GDP going back to the first quarter of 2009. Our animated chart below shows what changed:

The quick takeaways:
- The U.S. economy performed better than previously reported in 2009, as the December 2007 recession bottomed and began turning around.
- The economic recovery following the bottoming of the recession has been far weaker than the previously reported data indicated.
- We really don't know what to make of the GDP data recorded in 2011-Q4 onward, where the reported data is really characterized by its relative lack of adjustment in the BEA's 27 July 2012 revision. It would be really odd that after the rather large adjustments of 2009 through 2011-Q3 that the BEA would suddenly master the determination of GDP for just these most recent quarters.
Taking the bigger picture into account, given the typical 6 to 18 month lag in time from when macroeconomic policies are implemented to when they begin having a measurable effect upon the economy, it would appear that the policies implemented by the U.S. government and Federal Reserve in 2008 were more effective in arresting the decline of U.S. GDP and initiating the economic recovery in the second quarter of 2009 than the data previously suggested.
Meanwhile, the revised GDP data suggests that policies implemented by the U.S. government in and after 2009 would appear to have been largely ineffective in promoting a more robust economic recovery, as they failed build on the energy it took to arrest the decline and to begin the recovery in the first place.
We wonder when the policy makers of 2009 and afterward first recognized that their policies weren't working the way they believed they would. And perhaps a better question is why didn't they adapt those policies once they did?
Update
Our chart above uses the animated PNG format, where your ability to see the animation may depend upon whether your web browser supports the format. If that's not you, here are the frames for the animation:


Labels: data visualization, gdp
Do high gasoline prices affect the number of layoffs in the United States?
Three and a half weeks ago, we announced that we were going to run a live test on the U.S. economy to answer this question, where by having the average gasoline price across the nation drop below $3.50 per gallon, the level that has come to define high gasoline prices in the U.S., we would trigger a downward shift in the established trend for the number of seasonally-adjusted new jobless claims filed each week [1].
With yesterday's report on the number of initial unemployment insurance claims being filed through the week ending 21 July 2012, we can confirm that a such shift has indeed taken place. Here's the graphic proof:

As we had expected, the week of the 4 July 2012 holiday played a bit of havoc in our being able to claim success for our experiment sooner, as a number of automakers delayed their annual mid-year plant shutdowns by a week, amplifying the seasonally-adjusted figure reported by the Bureau of Labor Statistics for the week ending 14 July 2012. Simply put, the BLS' statistical adjustments didn't account for the difference in the timing of the automakers shutdowns from previous years, so the figure recorded for that week is far higher than it would otherwise have been recorded if the BLS' data jocks could have anticipated the automakers' change in practice from previous years.
In the next phase of our experiment, we're going to see if we can boost the national average price of gasoline in the U.S. back up over the $3.50 per gallon mark to trigger yet another shift in the number of layoffs resulting in new unemployment benefit claims filed each week before a new trend has a chance to really get started. With the price of Brent crude oil rising in recent weeks, which is pushing gasoline prices across the U.S. higher, we should observe a negative upward shift in the number of new jobless claims filed each week if we can sustain an increase in the price of Brent crude over $106.50 per barrel [2].
We're not sure yet if our Eurominions can do this, and we realize that many may be unhappy with our manipulation of global oil prices just for the sake of seeing if they affect the level of new jobless claims in the United States, but remember, "it's supposed to hurt. It's science!"
Besides, what can possibly go wrong?
Notes
[1] A less fun, alternate explanation for what's just happened is that we recognized that the average price of gasoline in the U.S. was about to fall cross the $3.50 per gallon level that has previously preceded shifts in the established trends for new jobless claims by 2-3 weeks, so we predicted that a shift in the established trend for new jobless claims would take place within two to three weeks, the typical lag time between an event that affects the business outlook for U.S. employers and when it shows up in the BLS' data.
[2] Don't blame us! There are other factors that have been driving up oil prices in recent weeks! We just happen to be at a place where we're close to where they result in crossing that critical $3.50 per gallon threshold again. As for our causing gasoline prices to change, well, that would be impossible for us to do, right?
[3] Shh! Somebody's noticed!
Labels: forecasting, jobs
A group of economists recently published an article looking at the statistical return to bank robberies in Britain. John Timmer reviews their results:
The results were not pretty. For guidance on the appropriateness of knocking over a bank, the authors first suggest that a would-be robber might check with a vicar or police officer, but "[f]or the statistics, look no further. We can help. We can tell you exactly why robbing banks is a bad idea."
The basic problem is the average haul from a bank job: for the three-year period, it was only £20,330.50 (~$31,613). And it gets worse, as the average robbery involved 1.6 thieves. So the authors conclude, "The return on an average bank robbery is, frankly, rubbish. It is not unimaginable wealth. It is a very modest £12,706.60 per person per raid."
"Given that the average UK wage for those in full-time employment is around £26,000, it will give him a modest life-style for no more than 6 months," the authors note. If a robber keeps hitting banks at a rate sufficient to maintain that modest lifestyle, by a year and a half into their career, odds are better than not they'll have been caught. "As a profitable occupation, bank robbery leaves a lot to be desired."
Worse still, the success of a robbery was a bit like winning the lottery, as the standard deviation on the £20,330.50 was £53,510.20. That means some robbers did far better than average, but it also means that fully a third of robberies failed entirely.
We thought we'd look at the economics of bank robbery in the United States, using the FBI's published statistics for bank crimes in 2011 as our starting point.
Here, the FBI combines 5,014 robberies, 60 burglaries and 12 larcenies into its total of 5,086 bank crimes in the U.S. for 2011.
Of these 5,086 bank crimes, 4,534 resulted in the offenders making off with loot, or 89.2% of the total. That is what we'll call our "initial success rate", as the remaining 552 bank crimes failed to produce any income at all for the offenders for any length of time.

Next, we factored in the 973 bank crimes where the loot that had been stolen was able to be recovered by law enforcement. That lowers the number of successful bank robberies in the United States in 2011 to 3,561. This figure also means that the actual success rate for robbing banks in the U.S. is much lower than our initial success rate would suggest, as the offenders were only able to hang onto the loot in 70.0% of all bank crimes.
We next looked at the offenders "take" - the loot they robbed from the banks! Since nearly 99.8% was in the form of cash, we limited our math to only consider this portion of their take.
The total amount of cash that offenders stole from banks in 2011 was $38,331,491.85. For the total of all 5,086 bank crimes, the average take per crime was $7,536.67.
Dropping out the bank crimes where the offenders failed to take any loot increases the take per initially successful crime to $8,454.23. Adjusting the math to take into account the $8,051,992.97 that law enforcement was later able to recover, we find that the average successful take of a bank robbery in the U.S. in 2011 is just slightly higher at $8,503.09.
Unlike Britain, where the average is 1.6 criminals per bank job, bank crimes in the U.S. would appear to be more of a solitary pursuit. For the 5,086 bank crimes recorded in 2011, the FBI believes just 6,088 people were involved. That works out to an average of 1.2 people per each bank crime.
The average take per successful offender then in the U.S. in 2011 is $7,085.91. This amount is the equivalent of working at the federal minimum wage of $7.25 per hour for just over 977 hours, or about six and a half months if working at that rate full time.
By contrast, the median expected annual salary of an entry level bank teller in the U.S. is $22,896.
So, if an offender wants to continue their life of stealing cash from banks and live at least as well as the lowly paid entry level employee they face across the counter as they commit their crimes, they'll have to rob more than two banks per year.
And that's where our tool today comes into play! Here, we're considering the odds that you'll continue to be successful in robbing banks if you continue to rob banks. Just enter the odds of success and the number of bank crimes into the tool and we'll do the rest!
Using our default 70% success rate, we estimate that a prospective bank robber has less than a 50% chance of successfully committing two bank robberies in their choice of career.
And suddenly, choosing to be that person behind the counter looks pretty good in comparison. If only Boston's "Trench Coat Bandit", pictured above, was that smart - somehow, we don't think the 22 and a half years he'll be staying as a guest of the state of Massachusetts pays as well in comparison.
With the role of red bureaucratic tape in hampering small business just in the news, we thought we'd take a historic look at how many pages of new rules and regulations the federal government spits out every year.
Or rather, in each year beginning with 1936, because that's all as far back as we could find the data! Our chart below visualizes what we found:

Generally speaking, with the exception of the period of World War 2, we find that the federal government used to be pretty well contained when it came to imposing new rules and regulations on the American people - at least, all the way up to 1970, when it appears to have undergone a bureaucratic explosion!
Here, the creation of the Environmental Protection Agency appears to have been the impetus for unleashing unprecedented waves of new rules and regulations affecting nearly every aspect of American life all throughout the next decade.
That changed in the 1980s, as the number of new rules and regulations being issued each year was brought under control. In the 1990s though, the number of federal regulations began creeping steadily upward.
In the first decade of the twenty-first century though, the amount of new rules and regulations issued each year was largely stable. That changed with the financial crisis of 2008, which saw new rules and regulations issued by the federal government spike in that year, but which abated with the waning of the crisis in 2009 as the number of pages issued to the Federal Register fell.
In 2010 however, President Obama cranked up the federal government's regulation mill to all time highs, keeping it there at least through 2011.
Wayne Crews' data for 2010 through 24 July 2012 indicates that the federal government is currently on pace to issue at least 76,300 pages of new rules and regulations this year, but we suspect the actual figure will be much larger.
The reason why is because of ObamaCare, where the recent Supreme Court decision allowing the law to go into effect will require the federal government to issue a very large number of new rules and regulations before next year:
With the Supreme Court giving President Obama's new health care law a green light, federal and state officials are turning to implementation of the law -- a lengthy and massive undertaking still in its early stages, but already costing money and expanding the government.
The Health and Human Services Department "was given a billion dollars implementation money," Republican Rep. Denny Rehberg of Montana said. "That money is gone already on additional bureaucrats and IT programs, computerization for the implementation."
"Oh boy," Stan Dorn of the Urban Institute said. "HHS has a huge amount of work to do and the states do, too. There will be new health insurance marketplaces in every state in the country, places you can go online, compare health plans."
The IRS, Health and Human Services and many other agencies will now write thousands of pages of regulations -- an effort well under way:
"There's already 13,000 pages of regulations, and they're not even done yet," Rehberg said.
We anticipate that most of the new rules and regulations related to the implementation of ObamaCare will be issued after the 6 November 2012 election, mainly to avoid drawing an even more negative response from voters beforehand. So add *that* to your fiscal cliff to worry about in 2013!
Data Sources
Crews, Wayne. Ten Thousand Commandments. Federal Register Pages, 1936-Present [Google Docs Spreadsheet]. Accessed 24 July 2012.
Crews, Wayne. Ten Thousand Commandments. Federal Regulation - The Updates. Accessed 24 July 2012.
Labels: data visualization
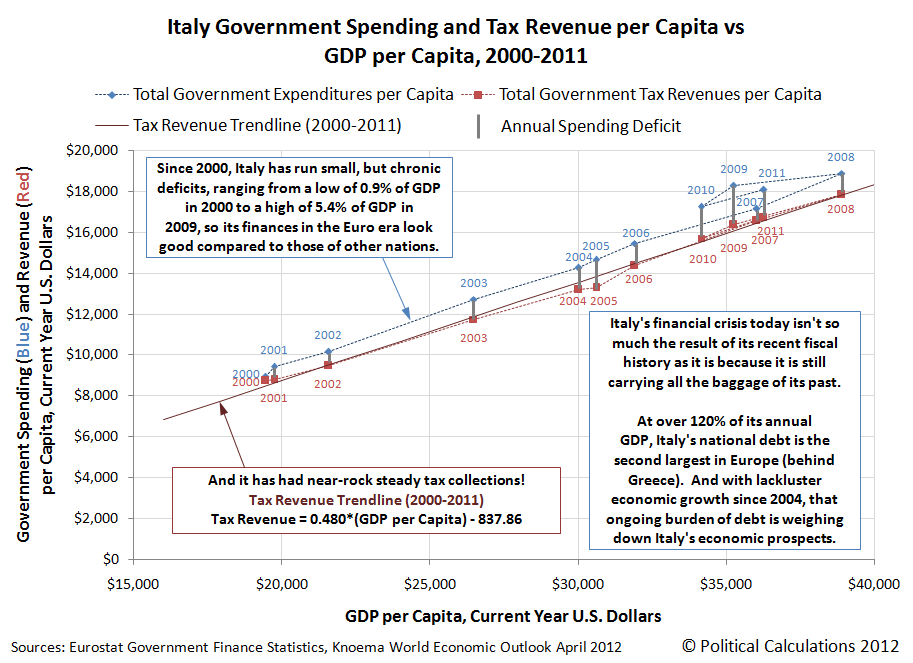
Italy is the eighth largest economy in the world and the second-biggest manufacturing economy in Europe. The Italian government's tax collections from year to year have been near rock-steady as a percentage share of the country's GDP and, for over a decade now, the country has been running comparatively small annual budget deficits.
And yet, the Italian government is now behaving as if its financial situation is so dire that the nation itself is in imminent danger of going under.
How exactly does that happen?
The short answer is that Italy is burdened by the policies of its past. In the 1980s, the nation began running up a truly phenomenal national debt in a short period of time, peaking at over 120% of the country's GDP in 1994, before falling back to be below 105% of GDP in 2007. Since then, it has ballooned back over 120% of GDP.

Starting from such a high level, Italy had little room to be able to absorb the impact from financial crises within its borders, such as the one driving markets today, where the Italian province of Sicily is at risk of defaulting on its own public debts and obligations.
PALERMO: As the Prime Minister, Mario Monti, fights to protect Italy from the contagion driving up its borrowing costs to perilous levels, one region in particular has been in the spotlight: Sicily, which some fear has become "the Greece" of Italy, at risk of defaulting on its high public debts.
Mr Monti wrote to Sicily's regional president last week warning that he had "serious concerns" that the region was at risk of default. The day before, an official in the Sicily branch of Italy's leading industrialists' association called for the island to be put into receivership by the central government to clean up its finances.
When headlines about a potential Sicilian default ricocheted around the globe, the government quickly played down concerns and said it would send €400 million ($469 million), to ease Sicily's liquidity crunch so it could continue to pay salaries and pensions. One government official said Mr Monti's letter had been intended for a domestic audience and that Sicily's problems could not spread to other Italian regions.
But with Europe's debt crisis, local politics quickly become international problems. And the flare-up over Sicily highlights the challenges that Mr Monti is facing in trying to use pressure from European leaders and international markets to push Italy's political class to cut costs.
The equivalent situation in the United States would be for the U.S. government to be forced to provide special financing for the state of Illinois, so it could continue functioning.
The problem though is the amount of borrowing the government would have to do to prop up the fiscally failing region. With such a high national debt level already, the government would have to add even more to it to fund its bailout, increasing the risk of a default.
Lenders respond to that situation by demanding higher interest rates on the money they loan to the government. The critical threshold appears to be when a country's bond yields (the interest rates that governments pay to the people who loan them money) rise above 7%, when bond traders have to begin posting more collateral because the government-issued debt has become riskier to bond investors, who must weigh in the increased probability that Italy will default on its debt to them.
If Italy's national debt burden, its national debt to national income (GDP) ratio hadn't already been so high, it would have been in a much better position to weather the crisis. Unfortunately, that high debt level and Europe's deteriorating economic situation have combined to put Italy at imminent risk of a fiscal crisis.
In other words, Italy has run out of its national debt safety margin. It is at imminent risk of failing today because of the crushing burden of its old debt, unlike other nations going through their own debt crises in the Eurozone:
... Italy - and Sicily in particular - has been driven into dire financial straits not by austerity but by the rampant public spending of the past, the product of an entrenched jobs-for-votes system that helped keep Italian governments in power and Sicilians employed.
Last month, Italy's audit court issued a scathing report saying that Sicily had €7 billion of liabilities at the end of 2011 and showed "signs of unstoppable decline". Sicily's unemployment rate is 19.5 per cent, twice the national average, and 38.8 per cent of young people do not have jobs.
Eventually, the supply of other people's money runs out and a long-delayed reckoning with reality takes place. For Italy, it appears that reckoning with its wasteful spending past will take place much sooner than its past leaders had hoped.
Labels: economics, national debt
Upon which income earners will fall the greatest burden of paying the greatest tax burden from the Patient Protection and Affordable Care Act (aka "ObamaCare")?
To find out, we tapped our detailed income distribution data for individuals for the year 2010, the most recent year for which it is available (the data for 2011 will be published in September 2012). We then took Henry Blodget's description of how ObamaCare's mandate penalty tax is calculated, then multiplied the amount of tax that would have to be paid for a given level of total money income by the number of people we estimate earned it in 2010!
Here's what we found:

Two quick notes:
- Over 90% of the burden of ObamaCare will be paid by individuals with incomes below $200,000.
- Over one third of the burden will fall upon people with incomes between $9,500 and $37,300, whose ObamaCare tax will be a flat $695 beginning in 2016.
Of course, the alternative to paying the ObamaCare mandate tax is to have health insurance, either on your own or through your employer, which in 2011, cost $5,429 on average for Single coverage and $15,073 for Family coverage in 2011. Henry Blodget describes the "maximum" tax that might have to be paid by high income individuals:
... the penalty can never be more than the cost of a "Bronze" heath insurance plan purchased through one of the state "exchanges" that will be created as part of Obamacare. The CBO estimates that these policies will cost $4,500-$5,000 per person and $12,000-$12,500 per family in 2016, with the costs rising thereafter.
And that's what sets up the lottery math for healthy Americans, who are much likelier to benefit by dropping their health insurance coverage than paying for it under the ObamaCare law.
Just so long as they also take steps to under-withhold their income taxes, since it appears that the IRS will only be able to collect the tax by seizing part or all of these individual's annual tax refunds!
Labels: health care, taxes
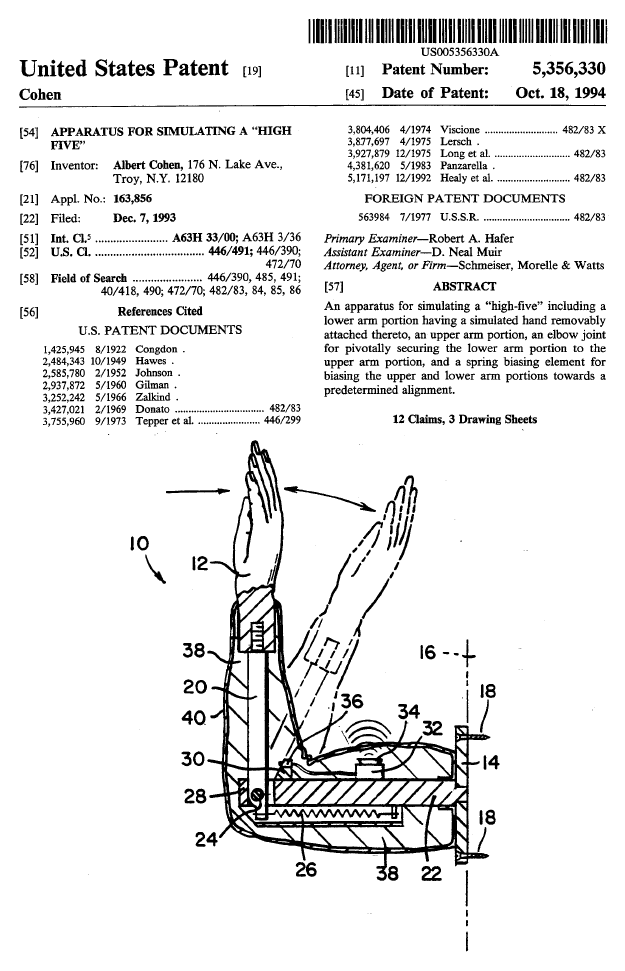
Just when we thought U.S. patents couldn't get any sillier, we found a patented invention for an "Apparatus For Simulating a 'High Five'"!
Issued to Albert Cohen of Troy, New York on 18 October 1994, U.S. Patent 5,356,330 solves the following problems:
...the hand-arm configuration of the invention allows a user to simulate a "high-five" in celebration of a positive event, thereby providing the user with a convenient outlet for the release of excitement. Further, the hand-arm configuration synergistically improves the hand-eye coordination of a user and/or, depending upon specific placement, provides an exercise device for enhancing the jumping skills of a user. More specifically, when the hand-arm configuration is mounted at a sufficient height above the normal reach of a user, the user must jump upwards to strike the simulated hand, thereby simulating many of the jumping drills commonly practiced by basketball players. As such, the leg strength and coordination of a user may be improved through the practice of the present invention.
No, we're not making this up! Here's what the invention looks like:
Here's hoping you have a positive event to simulate with a convenient outlet for your excitement this weekend!
And if it helps, here's an old clip of the "High Five'n White Guys" as they go site-seeing in Seattle (and yes, that really is a young Bill Nye)!
Labels: none really, technology

In mid-2008, General Motors was a failing company. Unable to unload their product line of gas guzzlers, the wrong cars and trucks to be trying to sell at a time of record high gasoline prices, the company's high union-driven labor costs were combined with the extremely high pension and health care costs it had awarded its unions in better times, the company was quickly heading for bankruptcy and quite possibly for liquidation.
In that environment, GM decided to bet big on a new mass market production car, one that could deliver 50 miles per gallon - more than double the mileage of the average vehicles of its product line - and it would bring it to market in 2010, making a technological leap in the process: the Chevrolet Volt.
From Failure to Federal Entity
And then, General Motors, as it was, failed. In December 2008, the company's management and its unions sought and received a special bridge financing from the federal government which would provide a cushion of time during which the company would attempt to restructure itself before becoming insolvent.

In January 2009, Barack Obama was sworn into office and changed the direction of the company's restructuring efforts, forcing out the company's CEO as he increased the federal government's role in managing the company as it prepared to enter bankruptcy. Ultimately, the U.S. government would become the largest stakeholder in the company that acquired GM's name, trademarks and assets in the company's bankruptcy. For all practical purposes, GM became an entity of the U.S. federal government.
In the restructuring that followed, GM closed plants, dealerships and shut down entire product lines as it laid off many of its employees. Yet the Chevy Volt, with its "green" imprimatur that augmented President Obama's willingness to spend billions of dollars to back various risky "clean energy" technology initiatives as part of his 2009 economic stimulus bill, was given the green light to go forward into production, even though it was clear that it would face a difficult path to market success in a recessionary economy.
After the Chevy Volt was introduced, it was declared to be 2011's Car of the Year, in both the United States and in Europe.
Declared by many in the press to be a innovation revelation, a "pioneering" automotive engineering and computer programming achievement. An primary electric battery-powered automobile that can travel solely on electricity for up to 50 miles before switching to a backup gasoline-powered motor, meaning it burns very little gasoline and emits very little pollution into the environment. A car whose electric battery can be recharged overnight by plugging it into a regular wall socket or very quickly using a special recharging station.

And yet, hardly anybody seems to want to buy it, even though its $39,995 sticker price can be offset with a special $7,500 federal tax credit, which would lower the basic price of the four door sedan for consumers to $32,495, making it very competitive with other vehicles in its class.
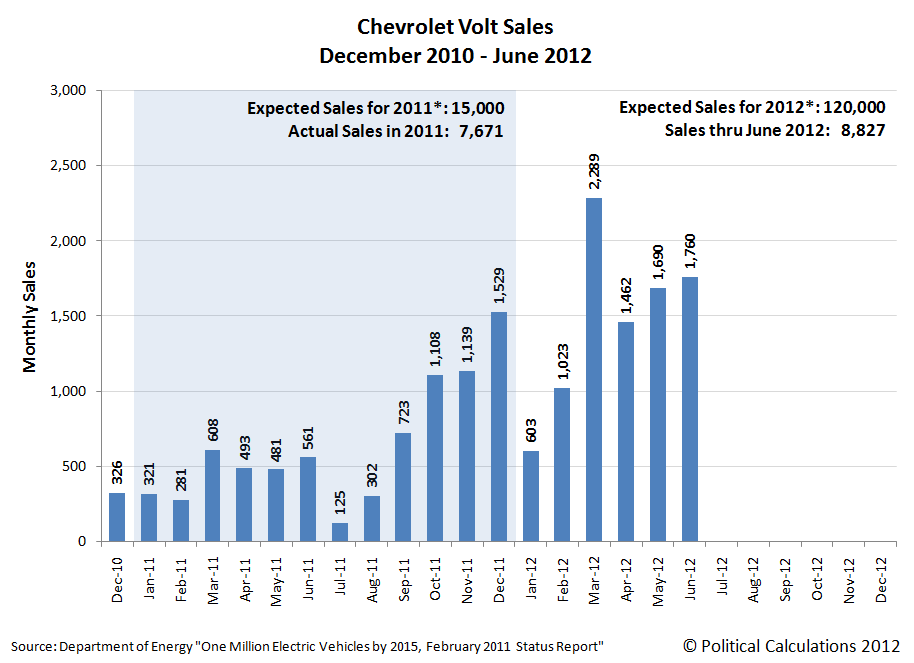
With sales so far below expectations, the Chevy Volt should be headed off the market, given that its production numbers are worse than the all-time automotive flop that was Ford's Edsel. And yet, there are two unique entities, aside from General Motors, that are determined to keep it afloat: the U.S. federal government and General Electric.
Stacking the Deck for His Favorites

It's easy to understand why the federal government under President Obama is so keen to use its power to make the Chevrolet Volt a success, as so many of President Obama's other green technology investments have failed. Here, to help stack the deck in the Chevy Volt's favor, President Obama has mandated that the vehicles that automakers produce must increase their average gasoline fuel efficiency to 35.5 miles per gallon by 2016, which will rise to an average of 54.6 miles per gallon by 2025.
By contrast, the average new vehicle fuel economy in February 2012 was 23.7 miles per gallon. Unless automakers like GM produce vehicles like the Chevrolet Volt in mass quantities and in very short order, they will have to pay large penalties to the federal government based upon how far below the fuel economy standard that their vehicles fall. As an established product on the market today, the Chevy Volt stands to benefit from the President's Obama's fuel economy mandate.
More interesting though is General Electric, itself a major federal bailout recipient in 2009, and a company whose nearly every product relies upon the federal government's contracts, mandates, subsidies and other support for its revenue.
Unable to compete in the marketplace independently of such government assistance, GE relies upon its close contacts with federal officials to sustain its revenues - using its influence to lobby for favorable legislation, affect regulations and their enforcement, and also to create special tax breaks from which it benefits.
That level of influence was kicked up a notch during the Obama administration as GE's CEO, Jeffrey Immelt, became a close adviser of President Obama, serving as the chairman of the President's Council on Jobs and Competitiveness.
Here, just months after the Volt had a major setback with a number of vehicle fires, General Electric announced in February 2012 that it would acquire nearly 12,000 Chevy Volts by 2015, and the sudden surge in sales for the Chevy Volt in March 2012 likely reflects a large number of GE managers and employees purchasing the car.
GE's motivating factor in supporting the Chevy Volt at such a critical time is fairly transparent. GE collects 10% of every dollar invested in electric vehicles.
On a side note, the ever-tax credit conscious company would also cash in on the $7,500 federal tax credit for each of its Chevy Volt purchases. For the full total of 12,000 Volts that GE has indicated it would purchase by 2015, the company will receive a total of $90 million back from the federal government. The gains for the company would be only greater if President Obama's 2012 budget proposal to increase the tax credit to $10,000 had gone anywhere.
GE then has a very direct stake in making sure the Chevy Volt succeeds in the market. If the Chevy Volt flops, a political change in Washington D.C. could derail President Obama's mandated fuel economy standards that are critical to GE's current business strategy.
As your "ecoimagination" might tell you, GE CEO Jeffrey Immelt is a major fan of automotive fuel economy standards, and since he has clearly had the President's ear, he has every incentive to use his special connection to push for standards that would force the adoption of the products GE manufactures. And if that means buying up to 12,000 Chevy Volts over the next three years to help keep its production line from permanently shutting down, and helping President Obama avoid the embarrassment of yet another green energy failure in the process, all the better for business in the Crony Capitalists Club.
Whether or not any of that is in the best interest of regular Americans is another matter. Clearly, despite President Obama's wishes that they should drive Chevrolet Volts, they are so far very determined to not do so.
It would be one thing if it were only GE, GM and individual American consumers who were involved, but under President Obama's federal government, every American taxpayer is being forced to contribute to all this waste for no meaningful purpose other than benefiting the members of the club. Instead, we find that the time, effort and resources being devoted toward putting Americans in Chevy Volts is proving to be economically destructive, especially when you consider that just about anything else would be a better use of these scarce resources.
References
U.S. Department of Energy. One Million Electric Vehicles by 2015, February 2011 Status Report. February 2011.
Labels: business
President Obama opened a controversy when he made the following comments during a campaign stop at a fire station in Roanoke, Virginia:
If you were successful, somebody along the line gave you some help. There was a great teacher somewhere in your life. Somebody helped to create this unbelievable American system that we have that allowed you to thrive. Somebody invested in roads and bridges. If you’ve got a business. you didn’t build that. Somebody else made that happen. The Internet didn’t get invented on its own. Government research created the Internet so that all the companies could make money off the Internet.
That was news to a lot of business people and entrepreneurs who actually have built their own businesses, many from scratch, many without the benefit of any government research or support. We wondered where President Obama may have gotten the idea businesses were so completely dependent upon the government to even be in business.
And then, it came to us! We remembered that two of the biggest business basket cases of President Obama's tenure in office are represented by General Motors and General Electric! Neither one of these companies is capable of existing without significant government support, as both are highly dependent upon government contracts, subsidies, mandates and special protections for their revenue.
In fact, both businesses are so dependent upon the federal government for their cash flows that they have effectively become junior partners or subsidiaries of the federal government. As a result, rather than recognizing that his proper role as President involves running the federal government and not setting the agendas for America's businesses, President Obama instead views himself as the CEO of America's crony capitalists.
What is crony capitalism? Investopedia explains:
A description of capitalist society as being based on the close relationships between businessmen and the state. Instead of success being determined by a free market and the rule of law, the success of a business is dependent on the favoritism that is shown to it by the ruling government in the form of tax breaks, government grants and other incentives.
Does the progressive worldview behind President Obama's comments seem clearer now?
If it helps bring greater clarity, there is a different word that perhaps better describes the political system that goes hand-in-hand with the economic system of crony capitalism: corporatism:
Corporatism, Italian corporativismo, also called corporativism, the theory and practice of organizing society into "corporations" subordinate to the state. According to corporatist theory, workers and employers would be organized into industrial and professional corporations serving as organs of political representation and controlling to a large extent the persons and activities within their jurisdiction.
In Part 2 of this series, we'll reveal what we suspect will become the modern-day example of why crony capitalism, and the corporatism it entails, is really a destructive economic and political system.
[Note: The link for Part 2 will not be live until 19 July 2012!]
We're going to feature three charts today, in which we'll compare the states of Maryland and Virginia in the United States. Why? Well, aside from the rivalry between each state's respective college football programs, Maryland has long held a reputation for reportedly being the home to the largest concentration of millionaires (aka "rich, seafood-loving snobs") in the United States, while Virginia maintains itself as a much more down-home kind of place, especially once when you get away from the parts closest to Maryland.
Is that changing?
We ask the question because of the ongoing controversy of whether or not Maryland's chronically high state income taxes are progressively convincing its highest income earners to live and work somewhere else.
To find out, we'll turn to the people who would know: the IRS. Since the 1997 tax year, the rapacious government agency has published data for the number of tax returns filed in each state, including breaking out data by Adjusted Gross Income (AGI) ranges. Even though what we'd really like to do is see how many million-dollar plus tax returns were filed in each state, the IRS has been inconsistent about reporting this data from year to year, so we'll substitute the number of tax returns filed in each year with am AGI of $200,000 or greater.
Our first chart shows the number of federal income tax returns filed in the states of Maryland and Virginia from 1997 through 2010:

Right away, we see that something is up - although both states started very near the same level in 1997, Virginia would appear to have strongly outpaced Maryland in adding to the ranks of its highest income earners in the years from 1997 through 2010.
But is that as strong a pace as it seems? There are two main factors that might play into the numbers here - the relative economic growth between the two states and the respective size of each state's population.
Considering economic growth first, we'll look at the year-over-year growth rate of the number of $200,000 or greater AGI earners, since that value would be more likely to be affected by economic factors, because incomes change faster than population. Here, a state with stronger economic performance will see higher growth rates, which affect the number of $200,000+ tax returns filed each year by boosting people's incomes.
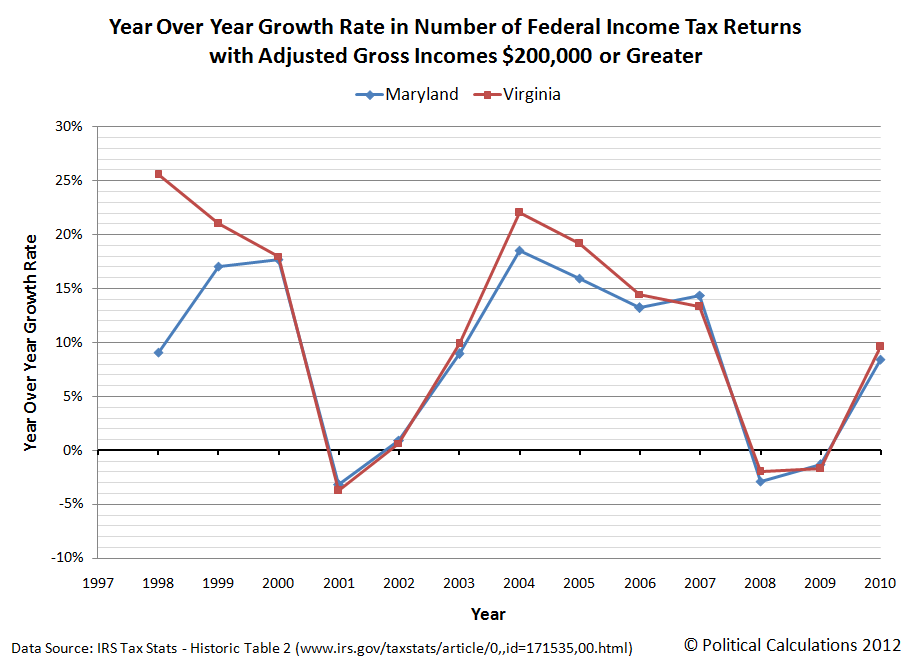
We find that Virginia has outpaced the economic growth of Maryland in eight of the 12 years of data presented in the chart, sometimes greatly, while Maryland has only edged Virginia in four. This factor suggests that Virginia's economy has been considerably more robust and dynamic than Maryland's economy has been during this period of time.
One thing we do note is that in bad economic times, which correspond to negative growth rates, each state's performance is similar, while Virginia has typically outstripped Maryland in good economic times. Even though its economy has gone through larger boom-bust type cycles, Virginia's busts have been no worse than those of Maryland's less dynamic economy.
That's not the entire story though, since we still need to consider the change in each state's population over time. To do that, we'll calculate each state's percentage of the number of tax returns with an AGI of $200,000 or more with respect to the total number of tax returns filed in each tax year from 1997 through 2010.

This chart is telling because what it communicates is that while Maryland has long had a larger share of higher income earners as compared to its full population of income tax filers, Virginia's population of high income earners as a share of its full population of income tax filers has nearly fully converged with the level observed in Maryland.
Taken all together with the data presented in the previous charts, what that means is that Virginia is doing much better than Maryland in attracting a growing number of high income earners to live and work within its state borders. If all things had been equal, we would see the gap between the percentage share of high AGI tax filers for Maryland and Virginia either hold largely constant over time, or if Maryland were a more positive place for high income earners, the gap would grow over time as Maryland's share of these tax filers would separate from Virginia. Instead, it appears that high income earners are increasingly finding their homes more often in Virginia than in Maryland.
There are reasons for that. And though this analysis doesn't definitively answer the question, each state's relative level of taxation on high income earners and their influence on the choice of where to live and work is among the reasons for what we observe.
References
IRS. Statistics of Income. Historical Table 2. 1997-2010. Accessed 17 July 2012.
Once upon a time, Harvard economist Greg Mankiw concocted a mathematical formula for predicting how the U.S. Federal Reserve would set its basic interest rate for U.S. banks: the Federal Funds Rate.
What makes the formula unique is that it incorporates data that captures the Federal Reserve's dual mandate, where it has been specifically directed by the U.S. federal government to promote policies that provide for price stability and for full employment, which it primarily does by periodically adjusting the value of the Federal Funds Rate, which in turn, affects nearly all other interest rates in the United States.
We say "primarily" because since January 2009, the Federal Reserve's Open Market Committee, the secretive gang of President-appointed and Congress-approved bankers who set the Federal Funds Rate, ran into a fundamental problem - they couldn't lower the value of the Federal Funds Rate to go below 0% as the U.S. economy entered into a highly deflationary environment with the worsening of a recession.
So the Fed had to turn to more exotic methods to try to stabilize prices, which were falling, and to maximize employment, which was also falling. And that's where the concept of quantitative easing came into play. Investopedia defines and explains:
Definition of 'Quantitative Easing'
A government monetary policy occasionally used to increase the money supply by buying government securities or other securities from the market. Quantitative easing increases the money supply by flooding financial institutions with capital, in an effort to promote increased lending and liquidity.
Investopedia explains 'Quantitative Easing'
Central banks tend to use quantitative easing when interest rates have already been lowered to near 0% levels and have failed to produce the desired effect. The major risk of quantitative easing is that, although more money is floating around, there is still a fixed amount of goods for sale. This will eventually lead to higher prices or inflation.
Since January 2009, the Federal Reserve has implemented two distinct rounds of Quantitative Easing, or QE, programs. The first, which we'll call QE1, ran from March 2009 through March 2010. The second, QE2, ran from September 2010 through June 2011.
With only these two episodes of quantitative easing to go by, we wondered if Mankiw's Approximate Federal Funds Rate, the math formula for which isn't affected by real world limitations like not being able to lower the Federal Funds Rate below zero, could be used to predict when the Federal Reserve might once again turn on the QE spigot.
To find out, we charted just over twenty full years worth of data to compare Mankiw's predicted Federal Funds Rate with the Federal Reserve's actual Federal Funds Rate and highlighted the periods in which the Federal Reserve's Quantitative Easing programs were in full effect. Our results are below:
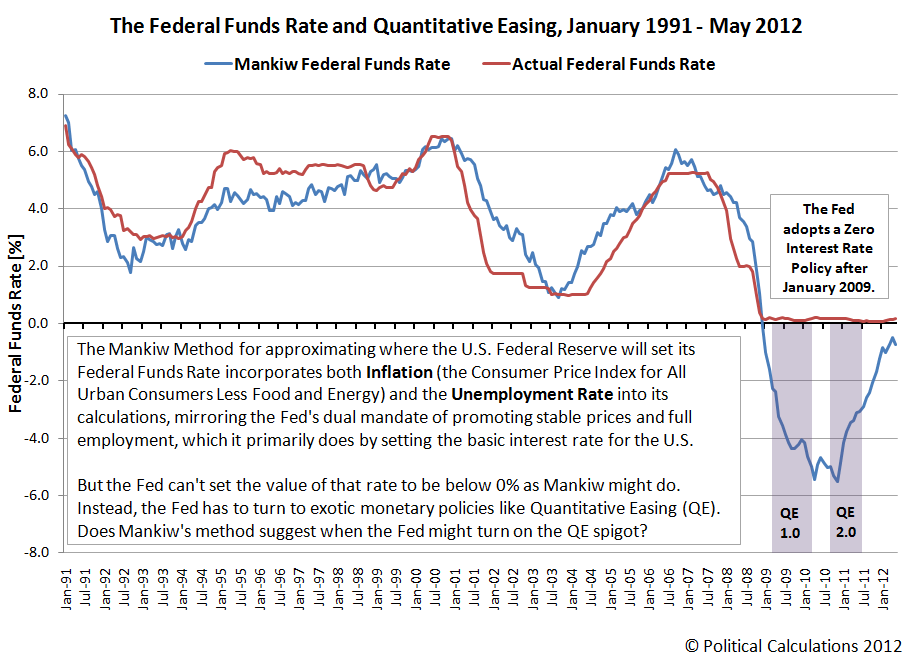
What we first find is the Fed moved very quickly after establishing its Zero Interest Rate Policy (ZIRP) to get QE1 up and going, as might be expected. But more important is what we observe for when the Fed acted to end its first QE program. Here, we find the the Fed stopped QE1 just as it the downward trajectory into negative interest rates that Mankiw's method would suggest to be necessary bottomed out.
That suggests that the Fed responded to an improving outlook for both inflation and employment in the U.S. economy, which we see in the form of Mankiw's predicted Federal Funds Rate rising for several months after that time.
That improving outlook was short-lived however, as the inflation and unemployment rate data that feed into the calculation of Mankiw's Federal Funds Rate began pulling Mankiw's predicted Federal Funds Rate lower. The Fed shortly responded with QE2, its second round of quantitative easing - keeping its foot on the gas long after a positive upward trend for the U.S. Federal Funds Rate had been established. Although the Fed ended its second quantitative easing program in June 2011, Mankiw's predicted Federal Funds Rate continued to rise for months afterward, and has closed in on the 0% line, but not crossed it.
Which brings us to today, at least through May 2012 (the most recent month for which we have inflation data at this writing.) What we find now is that Mankiw's predicted Federal Funds Rate, driven by a deteriorating situation for stable prices and employment in the U.S., has begun to recede back into negative territory in recent months.
What these patterns suggest to us is that while the Fed's Zero Interest Rate Policy remains in effect, a falling Mankiw predicted Federal Funds Rate is perhaps a good signal for anticipating when the Fed might launch a new round of quantitative easing. Going by the timing of when the Fed began its second experience with the policy, the current data suggests that the Mankiw predicted Federal Funds Rate will need to fall a bit further from where it is now and look to be likely to continue falling before the Fed might finally initiate QE3.
If however Mankiw's predicted Federal Funds Rate reverses and resumes rising, we can expect the Fed to do nothing with respect to quantitative easing.
Time will tell, and it will likely be some months yet before the Fed decides to pull the trigger, or not, on QE3.
Finally, aside from their intended effect upon the U.S. money supply, one of the more interesting characteristics of the Fed's QE programs has been that while they ran, they appear to have boosted stock prices about 10-15% higher than they might otherwise have been, which is perhaps the biggest reason why Wall Street is holding out such hope for a new round of quantitative easing these days.
Previously on Political Calculations
Labels: economics
Hundreds of years ago, Spanish settlers in the dry regions of the Americas developed a unique method for irrigating plants: burying terracotta pots next to their plants, which they would fill with water. Since unglazed ceramics like terracotta are porous, allowing water to slowly pass through their walls, the plants next to these buried pots would receive a steady flow of water.
Called ollas, this technology was used for hundreds of years up until the introduction of modern irrigation technology. And though some horticulturalists are trying to reintroduce the olla to modern gardens, it's an idea that few know.
That may change if designer Joey Roth's new planter design is any indication (HT: Core77). He's taken the basic idea of the olla and integrated it into a stylish pot:

The olla is integrated in the center, with the surrounding pot filled with soil and plants:

The water only moves out from the center when the soil around it becomes dry, which happens as the plant place in the outer section draw the water in the soil into their roots. The result is extremely efficient watering, with the plant getting just as much water as it needs when it needs it.
It occurred to us though that Joey Roth's planter design could easily be converted into a zeer pot, where one could fill the outer portion of the container with sand and water, which would then cool the inner container through the effect of evaporative cooling.
That's something that would come in really handy during the summer when entertaining outdoors. And to give credit where it's due, Joey Roth's design is a lot more stylish than the flower pot-in-flower pot contraption most greenies might put together!
Labels: technology
Today's post is an update of a chart we originally featured back on 5 January 2011. It speaks for itself:

In the chart, we're measuring the strength of all the post World War II recession recoveries as measured from the very bottom of payroll jobs lost. The last time we featured it, the recovery from the 2007 recession was just barely the worst ever.
And today, it is definitively the worst recession jobs recovery ever.
Labels: jobs
Now that the Patient Protection and Affordable Care Act (PPACA), more commonly known as "ObamaCare", has been declared to be constitutional, we thought we might revisit a topic we had originally considered after it was signed into law: Does it make more financial sense for you to pay for health insurance or to pay the ObamaCare mandate tax instead?
Ideally, ObamaCare is intended to provide health insurance coverage to all Americans, regardless of their current state of health. Unfortunately, the new law provides powerful and perverse incentives that can encourage healthy individuals to drop their current health insurance coverage altogether.
Chance of Going to Hospital
Age Group Female Male
Less than 1 1 in 3 1 in 2
1 - 10 1 in 10 1 in 8
10 - 20 1 in 9 1 in 10
20 - 30 1 in 4 1 in 8
30 - 40 1 in 3 1 in 6
40 - 50 1 in 4 1 in 4
50 - 60 1 in 3 1 in 3
60 - 70 1 in 2 1 in 2
70 and Older 4 in 5 (1 in 1.25) 4 in 5 (1 in 1.25)
Here's how that works. Under the law, individuals who have health insurance coverage either through their employer or on their own are excused from having to pay a tax that is based upon their household income. Those who do not have health insurance however will not be able to avoid having to pay this tax, which will be enforced by the IRS.
We should note that those who have health insurance aren't exactly coming out ahead. Even for Single coverage, the cost of health insurance is several times greater than the amount of the tax they would otherwise have to pay, which is what sets up a really perverse incentive for individuals to consider.
Because the law also requires health insurers to provide immediate coverage to individuals even if they have a pre-existing condition, an individual could reasonably choose to drop their insurance coverage, pay the much less expensive tax instead, and pocket the difference as savings until they actually might need coverage, with insurance companies compelled by law to provide insurance to these individuals on demand.
In a sense, that choice is no different than deciding whether or not to play the lottery based on the odds of winning, with the price of a ticket being represented by the tax and the grand prize being the potential savings and the odds determined by the probability of needing health insurance.
But would dropping insurance coverage actually make sense for healthy individuals? To find out, we've built a tool to run those kinds of numbers!
For 2011, the Kaiser Family Foundation's annual survey of Employer Health Benefits reports that the average annual premium for an individual health insurance policy in 2011 was $5,429, or $15,073 per family.
That contrasts with a potential penalty tax of the higher of either $695 per individual (or $2,085 per family) or 2.5% of annual income, which will go into effect in 2016 (HT: Bob Vineyard). So the only question left is "what are the odds of one needing health insurance on short notice?"
We'll define those odds as the chance that an individual will need care in a hospital. We found the statistics for Australia, which breaks those odds down by age and gender, and which we'll assume are similar for individuals in the United States.
Playing with the numbers in our tool, what we find is that the less likely an individual will need medical care, the more it is to their advantage to drop their current health care coverage and become uninsured, buying it only if it becomes necessary, then to drop it again once its not needed.
We also find that it takes a very high level of income to justify continuing one's health insurance coverage. In both cases, the worst off an individual would be is if they must pay both the tax penalty and the annual health insurance premium year they require it. But then, if enough people drop their coverage to pocket the savings, look for health insurance premiums to rise at rates even faster than they do today!...
Labels: health care, tool
Since 2012's first quarter earnings season ended, there has been very little change in the expected future level of dividends per share for the U.S. stock market:

Is it really all that surprising then that stock prices have largely languished in the time since?
It's true - aside from being pumped up by noise from the news and rumors of actions to prop up the failing governments of the Euro zone, stock prices have basically just gone sideways since:
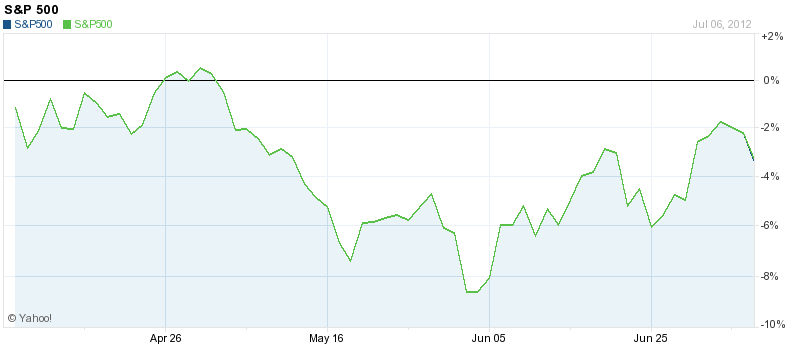
In fact, stock prices would have gone lower if not for all the noise of central bank rescue rumors of fiscally-failing nations in the Eurozone! You can see that in the spike in our chart below for June 2012:
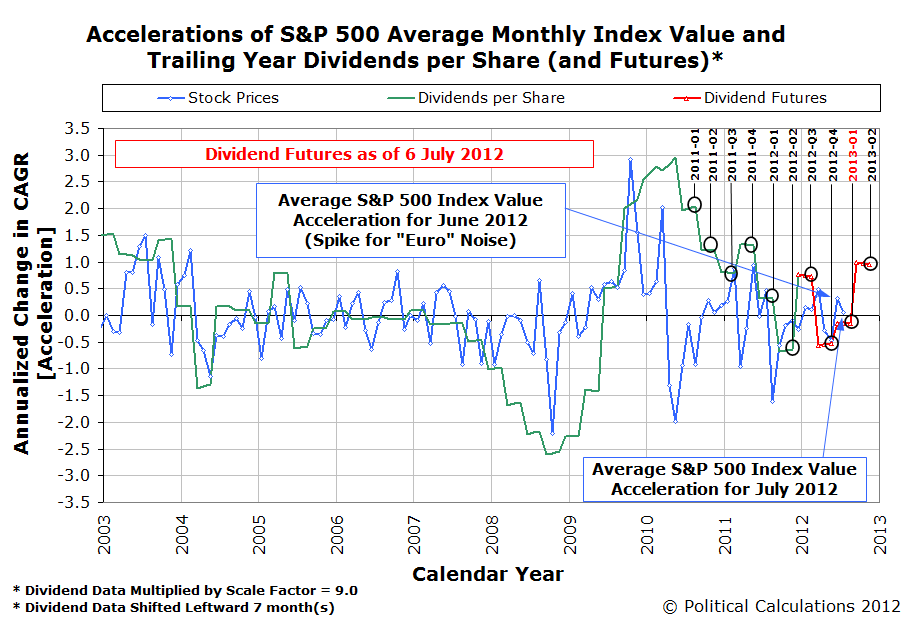
As for where stock prices are today, they're still a bit elevated, but as you can see in the chart above, they're pretty close to converging with where investors focused on the expected level of dividends for the first quarter of 2013 would put them.
But looking at that chart, a good question to ask is when will the expectations for dividends in the second quarter of 2013 begin driving stock prices?
The answer, as best as we can tell right now, is sooner than you might think, and with much less benefit than you might imagine.
Which is all probably the best we can hope for in this summer of dividend doldrums!
Welcome to the blogosphere's toolchest! Here, unlike other blogs dedicated to analyzing current events, we create easy-to-use, simple tools to do the math related to them so you can get in on the action too! If you would like to learn more about these tools, or if you would like to contribute ideas to develop for this blog, please e-mail us at:
ironman at politicalcalculations
Thanks in advance!
Closing values for previous trading day.
This site is primarily powered by:
CSS Validation

RSS Site Feed
JavaScript
The tools on this site are built using JavaScript. If you would like to learn more, one of the best free resources on the web is available at W3Schools.com.
Other Cool Resources
Blog Roll


