As long expected, the U.S. Federal Reserve hiked short term interest rates in the U.S. at the conclusion of its 18-19 December 2018 meeting, increasing the target range for their Federal Funds Rate by a quarter point to 2.25%-2.50%.
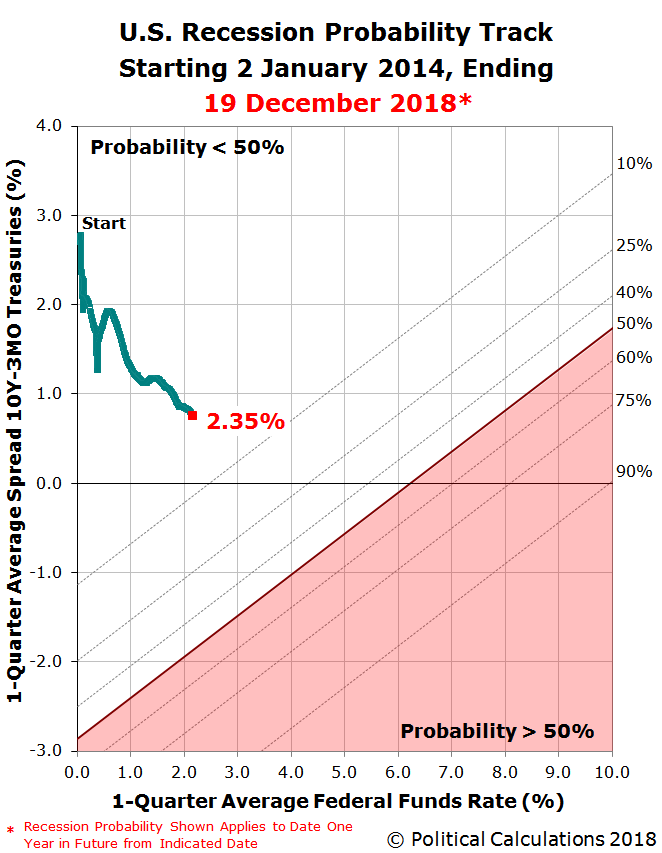
The risk that the U.S. economy will enter into a national recession at some time in the next twelve months now stands at 2.4%, which is up by roughly half of a percentage point since our last snapshot of the U.S. recession probability from early-November 2018. The current 2.4% probability works out to be about a 1-in-42 chance that a recession will eventually be found by the National Bureau of Economic Research to have begun at some point between 19 December 2018 and 19 December 2019, according to a model developed by Jonathan Wright of the Federal Reserve Board in 2006.
That increase from our last snapshot is roughly equally attributable to the Fed's most recent quarter point rate hikes on 26 September 2018 and to the recent flattening of the U.S. Treasury yield curve, as measured by the spread between the yields of the 10-Year and 3-Month constant maturity treasuries, which has seen the 10-Year Treasury yield decrease as the bond market has priced in increased prospects for a global economic slowdown.
The Recession Probability Track shows where these two factors have set the probability of a recession starting in the U.S. during the next 12 months.
We continue to anticipate that the probability of recession will continue to rise into 2019, partially as a consequence to today's rate hike and also because the Fed communicated that it is likely to continue hiking the Federal Funds Rate up to three times in 2019. ZeroHedge captured the market's shock:
"Everything was awesome" and then Jay Powell said...
"Some years ago, we took away the lesson that the markets were very sensitive to news about the balance sheet, so we thought carefully about how to normalize it and thought to have it on automatic pilot, and use rates to adjust to incoming data. That has been a good decision, I think, I don't see us changing that.... we don't see balance sheet runoff as creating problems"
And everything broke...
Overnight futures show hopeful buying - "surely The Fed will deliver and capitulate... for goodness sake, someone has to rescue my FANG portfolio!!??" - But The Fed did not - cutting their rate outlook by a mere one hike, with plenty still seeing 3 hikes ahead in 2019...
The market has a different perspective, where the CME Group's FedWatch tool is now anticipating no further rate hikes in 2019, and even the prospects of a rate cut in late 2019 or early 2020.
Scott Sumner provides more insight into the market's reaction:
The Fed delivered two monetary shocks today. The first occurred at 2:15pm, and caused yields on 2 and 5 -year bonds to increase. The second occurred about 30 minutes later, and caused yields on 2 and 5-year bonds to fall back, and end the day slightly lower. And yet both shocks seemed “contractionary” in some sense. Obviously there are some very subtle distinctions here, which require an understanding of Keynesian and Fisherian monetary shocks. More specifically, the first shock was Keynesian contractionary and the second was Fisherian contractionary.
At 2:15 the Fed raised its target rate as expected, and also indicated that another two rate increases are likely next year. This announcement was a bit more contractionary than expected, especially the path of rates going forward. As a result, 2 and 5-year yields rose, while 10-year yields fell on worries that the action would slow the economy, eventually leading to lower rates.
Later, the markets became increasingly worried that the Fed was not sufficiently “data dependent”, that it would plunge ahead with “quantitative tightening” and that the Fed stance on rates (IOR) would be too contractionary. Watching the press conference, I had the feeling that Powell might have wanted to be a bit stronger in emphasizing that no more rate increases are a clear possibility, but felt hemmed in by his colleagues at the Fed. But perhaps I was reading into it more than was there. In any case, Powell said “data dependent”, but didn’t really sell the markets that he was sincere, or as sincere as the market would wish. This monetary shock probably reduced NGDP growth expectations, and drove 2 and 5 year yields lower.
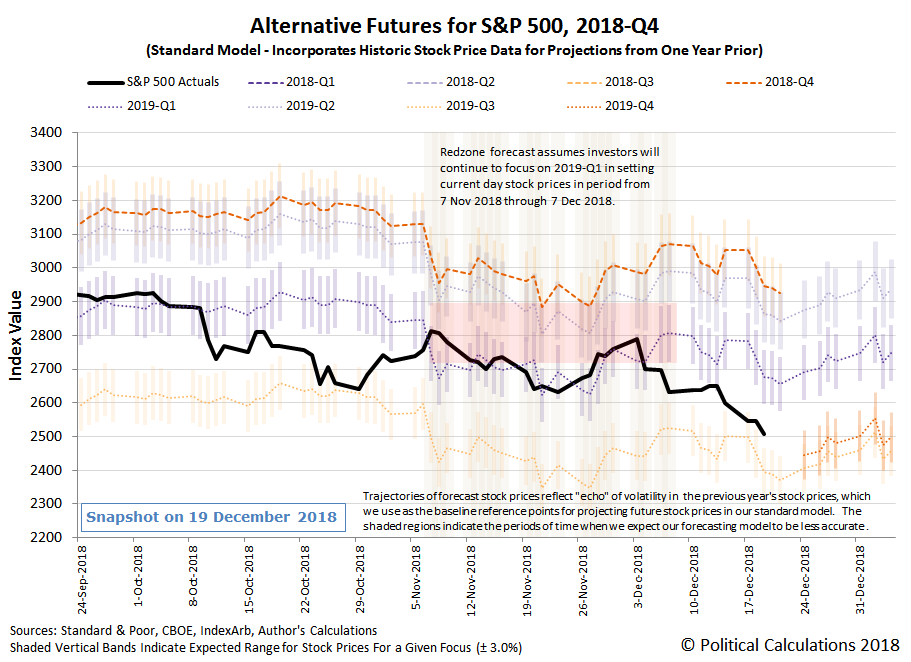
As for the U.S. stock market, the Fed's announced rate hike combined with Fed Chair Jerome Powell's press conference statements were sufficient to shift the forward-looking focus of investors toward 2019-Q3/2019-Q4 in setting stock prices, nearly fully completing the U.S. stock market's fifth Lévy flight event of 2018.
The U.S. stock market's fifth Lévy flight event of 2018 began on 4 December 2018 as investors reacted to the partial inversion of the U.S. Treasury yield curve and to New York Fed President John Williams' tone-deaf, hawkish comments promising more rate hikes well into 2019 on that date.
Update 8:25 AM EST: First Trust's Brian Wesbury and Robert Stein argue the stock market overreacted on Wednesday, 19 December 2018, while AQR's Cliff Asness holds that the reaction to the market's reaction is overwrought. From our perspective, that stock prices behaved as they did was predictable, where in the absence of a significant deterioration in the expectations for future dividends or a new noise event, the S&P 500 is now within several percent of its floor in the near term. We would not be surprised to see a bounce off this level, which would look like a correction to an overreaction, as investors may shift at least part of their forward-looking attention toward a different point of time in the future. The problem for investors is that the expectations for slow dividend growth associated with 2019-Q3/2019-Q4 are already long established, where they will overshadow their future outlook for some time.
Getting back to the topic of recession forecasting, it should be noted that Wright's model is based on historic data where recessions have generally started at much higher interest rates than they are today, and which also doesn't consider the additional quantitative tightening that the Fed might achieve through reducing the holdings of U.S. Treasuries on its balance sheet, where we're stretching the model's capability to assess the probability of recession in today's economic environment. It is quite possible that the model is understating the probability of recession starting in the U.S. when the Federal Funds Rate is as low as it is today, which is a subject we expect to explore further in upcoming posts in this series.
Meanwhile, if you want to predict where the recession probability track is likely to head next, please take advantage of our recession odds reckoning tool, which like our Recession Probability Track chart, is also based on Jonathan Wright's 2006 paper describing a recession forecasting method using the level of the effective Federal Funds Rate and the spread between the yields of the 10-Year and 3-Month Constant Maturity U.S. Treasuries.
It's really easy. Plug in the most recent data available, or the data that would apply for a future scenario that you would like to consider, and compare the result you get in our tool with what we've shown in the most recent chart we've presented. The links below present each of the posts in the current series since we restarted it in June 2017.
Previously on Political Calculations
- The Return of the Recession Probability Track
- U.S. Recession Probability Low After Fed's July 2017 Meeting
- U.S. Recession Probability Ticks Slightly Up After Fed Does Nothing
- Déjà Vu All Over Again for U.S. Recession Probability
- Recession Probability Ticks Slightly Up as Fed Hikes
- U.S. Recession Risk Minimal (January 2018)
- U.S. Recession Probability Risk Still Minimal
- U.S. Recession Odds Tick Slightly Upward, Remain Very Low
- The Fed Meets, Nothing Happens, Recession Risk Stays Minimal
- Fed Raises Rates, Recession Risk to Rise in Response
- 1 in 91 Chance of U.S. Recession Starting Before August 2019
- 1 in 63 Chance of U.S. Recession Starting Before September 2019
- 1 in 54 Chance of U.S. Recession Starting Before November 2019
- 1 in 42 Chance of U.S. Recession Starting Before December 2019
Labels: recession forecast
Welcome to the blogosphere's toolchest! Here, unlike other blogs dedicated to analyzing current events, we create easy-to-use, simple tools to do the math related to them so you can get in on the action too! If you would like to learn more about these tools, or if you would like to contribute ideas to develop for this blog, please e-mail us at:
ironman at politicalcalculations
Thanks in advance!
Closing values for previous trading day.
This site is primarily powered by:
CSS Validation
RSS Site Feed
JavaScript
The tools on this site are built using JavaScript. If you would like to learn more, one of the best free resources on the web is available at W3Schools.com.


