If you saw Reuters' headline for January 2023's U.S. new home sales, you already know most of the story:
U.S. new home sales jump to 10-month high in January, prices fall
Let's get into the raw numbers. Nonseasonally-adjusted new home sales were indeed higher, jumping by 12,000 to 59,000 sales from December 2022's revised estimate. At the same time, the average price of a new home sold in January 2023 plunged by nearly 13%, or $69,800, from the previous month's average to reach $474,400, the lowest figure recorded since August 2022. That combination of sales and average price gives the U.S. new home industry a market cap of $25.2 billion for January 2023, and increase of over $3.3 billion, or 15.3%, from December 2022's level.
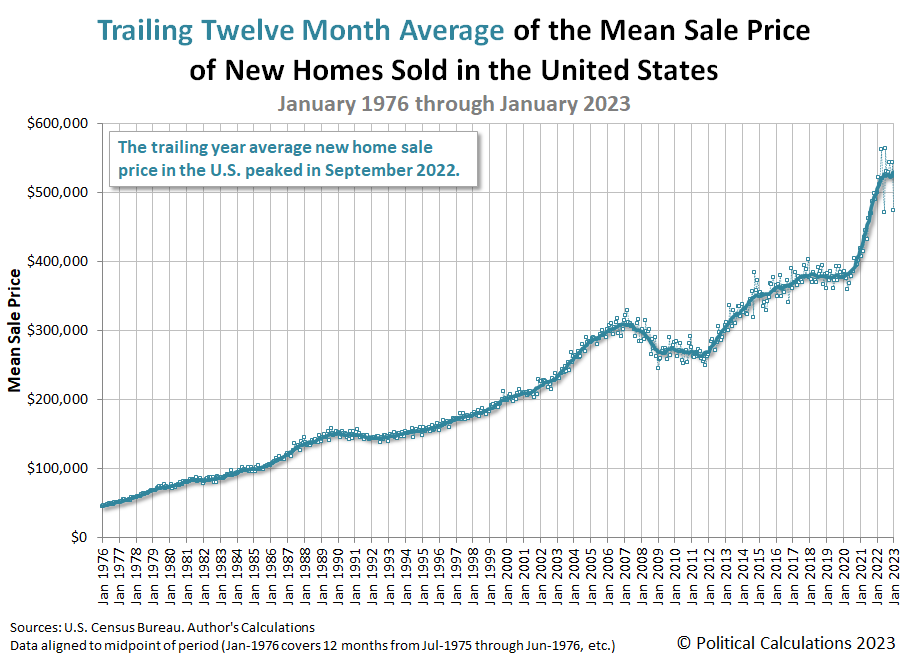
But one month doesn't make a trend, much less break what has been a major downturn for new home builders. Let's look at the time-shifted, trailing twelve month average for each of these measures to see what effect the initial estimates for January 2023's new home have had on the new home market's overall health. Here is the latest update to our chart illustrating the market capitalization of the new home market, spanning monthly data from January 1976 through January 2023.
The partially complete time-shifted rolling twelve month average of the U.S. new home market capitalization for January 2023 is $24.81 billion. That figure represents an increase from December 2022's revised $24.54 billion and is the first month-over-month increase since March 2022. The following two charts show the latest changes in the trends for new home sales and prices:
In terms of the trend, the positive change in sales outweighed the fall in new home sale prices, slowing the overall rate at which the industry's market cap for new home sales is falling.
But there's more to the story. Here are excerpts from Reuters' coverage of January 2023's new home sales, which point to an additional factor that complicates the picture from changing how you might expect from the data:
Sales of new U.S. single-family homes jumped to a 10-month high in January as prices declined, but a resurgence in mortgage rates could slow a much anticipated housing market turnaround....
Mortgage rates have resumed their upward trend after robust retail sales and labor market data as well as strong monthly inflation readings raised the prospect of the U.S. central bank hiking interest rates into the summer.
The 30-year fixed mortgage rate increased to an average of 6.50% this week from 6.32% in the prior week, according to data from mortgage finance agency Freddie Mac. The third straight weekly increase lifted the rate to a three-month high.
We'll take a closer look at how all these changes affected the affordability for new homes in the U.S. sometime next week.
References
U.S. Census Bureau. New Residential Sales Historical Data. Houses Sold. [Excel Spreadsheet]. Accessed 24 February 2023.
U.S. Census Bureau. New Residential Sales Historical Data. Median and Average Sale Price of Houses Sold. [Excel Spreadsheet]. Accessed 24 February 2023.
Image credit: Photo by Tierra Mallorca on Unsplash.
Labels: real estate
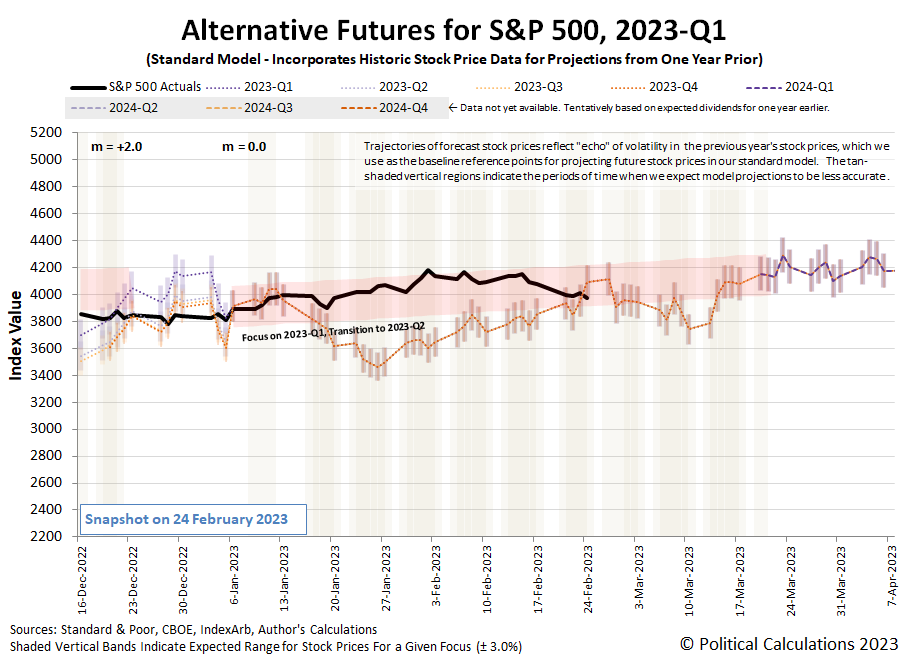
The S&P 500 (Index: SPX) lost nearly 2.7% of its value during the Presidents Day holiday-shortened trading week ending on Friday, 24 February 2023. The index closed the week at 3970.04.
Most of that change took place on Tuesday, 21 February 2023 as more indications of a global economy slowdown arrived. The rest of that change took place on Friday, 24 February 2023 as evidence inflation is running hotter than expected became known. The combination of these developments dragged the S&P 500 lower toward the bottom end of our recently adjusted redzone forecast range.
If you recall last week's edition, the redzone forecast shown in the alternative futures chart reflects the hypothesis the U.S. stock market has entered a new regime. Our main alternate hypothesis, the old market regime still holds but the S&P 500 is running hot, may soon come back into play.
How will we know? We'll be able to tell if the trajectory of the S&P 500 persistently falls below the redzone forecast range shown shown in the chart above. We should find out pretty quickly.
In the meantime, here are the market moving headlines from the short trading week that was!
- Tuesday, 21 February 2023
-
- Signs and portents for the U.S. economy:
- Positive signs of growth in Eurozone, Canada:
- German business activity back to growth after eight months -flash PMI
- French economy moves back into growth territory in February -flash PMI
- Canada December retail sales up 0.5% on autos, seen up 0.7% in January
- Bigger trouble developing in Japan while signs of slow growth are seen:
- Japan's factory activity shrinks at fastest pace in 2-1/2 years-PMI
- BOJ's Kuroda: Wage growth to accelerate on tight job market
- Japan says economy in modest recovery, caution over global slowdown
- More central banks planning to pause rate hikes:
- ECB minions say Eurozone wage inflation is nothing to worry about:
- Wall Street posts worst day of 2023 on higher-for-longer rate fears
- Wednesday, 22 February 2023
-
- Signs and portents for the U.S. economy:
- U.S. mortgage interest rates jump to highest level since November - MBA
- Oil drops 3% as high inflation risks stoke demand worries
- Fed minions say they want inflation under control, investors place bets on more rate hikes:
- Fed is 'absolutely' committed to 2% inflation target, Williams says
- Bullard calls on Fed to get inflation under control this year
- Fed funds futures contracts price in further quarter-point hikes
- Fed minutes show officials mulled financial stability risk amid aggressive hikes
- Bigger stimulus developing in China:
- BOJ minions have their hands full keeping never-ending stimulus alive:
- Japan govt bond breaches yield cap, BOJ steps in with buying, loans
- BOJ board member calls for keeping ultra-easy policy for now
- Japan's modest business services price rise highlights dilemma for central bank
- Some central bank minions still hiking rates:
- New Zealand hikes rates to over 14-yr highs, flags more to come; kiwi rallies
- Sticky inflation to nudge Reserve Bank of India to hike rates once more - Reuters poll
- S&P ends down as Fed minutes fail to halt losing run
- Thursday, 23 February 2023
-
- Signs and portents for the U.S. economy:
- Oil settles up 2% on tightening supply, demand concerns linger
- U.S. manufacturers see big boost from government subsidies and tax breaks
- 'Stubborn' food inflation leaves U.S. shoppers with slim appetite for other goods
- U.S. labor market resilient; inflation hotter in fourth quarter
- China economy performs better without government's failed zero-COVID lockdowns, other problems remain:
- China's consumer market shows 'strong' recovery in January - commerce ministry
- In China, more families on the fence on home buying, foreclosures cloud sector
- Bigger inflation developed in Eurozone:
- BOJ minions say they'll keep never-ending stimulus alive:
- Wall St ends topsy-turvy day higher, S&P snaps losing streak
- Friday, 24 February 2023
-
- Signs and portents for the U.S. economy:
- U.S. consumer spending posts biggest gain in nearly two years; inflation picks up
- Oil flat on week as U.S. inventories rise but Russia cuts supply
- U.S. new home sales jump to 10-month high in January, prices fall
- Fed minions expected to deliver bigger rate hikes, recession. Say having women and minorities on Fed's boards will help slow inflation without tanking the U.S. economy:
- Further Fed hikes expected after data dashes 'disinflation' hopes
- Fed's Mester says hot inflation data affirms case for more rate hikes
- Fed's Collins says more rate hikes needed to curb 'too high' inflation
- Fed needs a recession to win inflation fight, study shows
- Bigger trouble developed in Eurozone:
- German economy shrinks 0.4% in fourth quarter, weak start to 2023 seen
- One year of war in Europe: How the dollar, energy and food prices swirled
- China's central bank minions guarantee growth with forceful monetary policy:
- BOJ minions' new boss speaks, endorses never-ending stimulus as Japan's consumer inflation hits 41 year high:
- Incoming BOJ chief says low rates remain appropriate - for now
- Japan's consumer inflation hits 41-year high, keeps BOJ under pressure
- Wall St closes sharply down, biggest weekly drop of 2023
The CME Group's FedWatch Tool continues to project a quarter point rate hike at the Fed's upcoming 22 March (2023-Q1) meeting, followed by another at its 3 May (2023-Q2) meeting and yet another at the Fed's 14 June (2023-Q2) meeting, with rates topping out in a target range from 5.25%-5.50%. After that, the FedWatch tool now anticipates the Fed will hold rates steady through the end of 2023, taking rate cuts off the table for the year.
The Atlanta Fed's GDPNow tool's projection for real GDP growth in the first quarter of 2023 rose to +2.7% from its previous +2.5% estimate.
Image credit: Photo by Patrick Weissenberger on Unsplash.
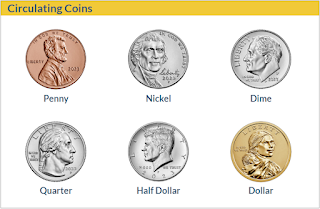
Ready for a seemingly simple riddle? What is the maximum value of U.S. coins you can have without being able to make exact change for one dollar?
Before you answer, a word of warning! According to the experts at Puzzling, there's no clever formula you can use to directly solve this problem. Instead, you have to more-or-less slog your way through it in a brute force-like process of trial and error! [Warning: Puzzling also provides the solution in their discussion. Click through if and when you're ready for it, but you may want to hold off until you've finished here first!...]
Fortunately, we can help automate that process! We've built the following tool to help you work through any solution you might like to try. Just enter the number of coins for each type and our tool will tally up their total value and help guide you toward a valid solution! If you're reading this article on a site that republishes our RSS news feed, please click through to our site to access a working version of the tool.
If you need a hint for how to find the solution, read on! You are looking for the highest value of a combination of coins that, if you were to add just one more coin of any type into the mix, whether it be a penny, nickel, dime, quarter, or half-dollar, you would be able to produce exact change for a U.S. dollar bill. Whether that's possible with more or less than $1.00 in coins is something you will discover!
In this tool, we've omitted the one-dollar coin as an option because, by definition, this coin alone is exact change for a dollar, so having one would automatically wreck your chances of discovering the solution. Plus, despite the U.S. Mint's claims of one dollar coins being in circulation, in practice, these coins are so incredibly unpopular with the American public, they might as well not be.
Good luck!
Image Source: U.S. Mint.
Since the beginning of the year, we've made frequent mentions of the improving outlook for the dividends of the S&P 500 (Index: SPX) in our weekly S&P 500 chaos series. Because it's time to take a mid-quarter of the expectations for the index' dividends per share as part of another of our ongoing series, we're turning to basic animation to show when and by how much those expectations have changed since the end of 2022.
Let's set the stage. December 2022 was a gloomy month for the expected future of the S&P 500's dividends. From 5 December 2022 onward, there was very little movement in the dividends per share expected to be paid out in each of the future quarters of 2023. Worse, the CME Group's S&P 500 quarterly dividend futures projected dividend payouts would decline during the third and fourth quarters of 2023. With those values below the same quarters in 2022, the CME Group's futures were signaling a dividend recession in the second half of 2023.
In the following animated chart, we'll pick up the action from 30 December 2022 and proceed day-by-trading day thorugh 15 February 2023. If you read the latest installment of the S&P 500 chaos series, you already have a good idea of when the main event begins.
In case you missed it, the period around 6 January 2023 looks to be a significant in marking the end of the old regime and the beginning of a new one for the U.S. stock market. Meanwhile, as of the midpoint of 2023-Q1, the CME Group's S&P 500 quarterly dividend futures are no longer signaling a year-over-year decline in the index' quarterly dividend payouts during 2023.
More About Dividend Futures Data
The dividend futures data we visualized in the animated chart is based on our records of the S&P 500's Quarterly Dividend Index Futures reported by the CME Group on each trading day from 30 December 2022 through 15 February 2023.
Dividend futures indicate the amount of dividends per share to be paid out over the period covered by each quarters dividend futures contracts, which start on the day after the preceding quarter's dividend futures contracts expire and end on the third Friday of the month ending the indicated quarter. So for example, as determined by dividend futures contracts, the now "current" quarter of 2023-Q1 began on Saturday, 17 December 2022 and will end on Friday, 16 March 2023.
That makes these figures different from the quarterly dividends per share figures reported by Standard and Poor. S&P reports the amount of dividends per share paid out during regular calendar quarters after the end of each quarter. This term mismatch accounts for the differences in dividends reported by both sources, with the biggest differences between the two typically seen in the first and fourth quarters of each year.
Because we're not mixing S&P's data with the CME Group's dividend futures data, the animated chart is providing an apples-to-apples comparison for the different snapshots in time of investor expectations.
Previously on Political Calculations
- The Future ofr the S&P 500's Dividends in 2023 - 22 December 2022
- Brightening Outlook for 2023 Dividends Boosts S&P 500 - 17 January 2023
- The S&P 500 Rises as Index' Dividend Outlook Improves - 30 January 2023
Image credit: Photo by Jeremy Yap on Unsplash.
Labels: data visualization, dividends, forecasting, SP 500
Every three months, we take a snapshot of the expectations for future earnings in the S&P 500 (Index: SPX) at approximately the midpoint of the current quarter, shortly after most U.S. firms have announced their previous quarter's earnings.
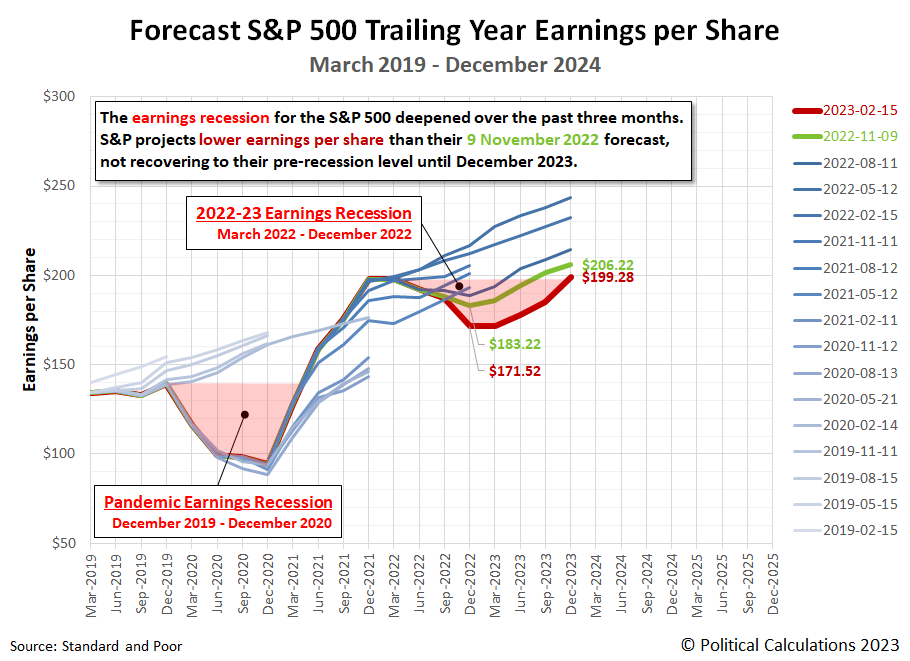
Since our last update three months ago, the S&P 500's earnings recession deepened and lengthened again. The bottom dropped to at least $171.52 earnings per share, down from the $183.22 projected during our Fall 2022 snapshot. Looking further forward, to the end of 2023, expectations for the S&P 500's earnings also declined, but by a smaller amount. The S&P 500's earnings at the end of December 2023 are now expected to be $199.28 per share, down from $206.22 per share.
At the same time, Standard and Poor projects the new earnings recession will not recover to its pre-earnings recession level until December 2023. The following chart illustrates how the latest earnings outlook has changed with respect to previous snapshots:
About Earnings Recessions
Depending on who you talk to, an earnings recession has one of two definitions. An earnings recession exists if either earnings decline over at least two consecutive quarters or if there is a year-over-year decline over at least two quarters. The chart identifies the periods in which the quarter-on-quarter decline in earnings definition for an earnings recession is confirmed for both the Pandemic Earnings Recession (December 2020-December 2021) and the new earnings recession (March 2022-December 2022) according to the first definition. The regions of the graph shaded in light-red correspond to the full period in which the S&P 500's earnings per share remained below (or are projected to remain below) its pre-earnings recession levels.
Our next snapshot of the index' expected future earnings will be in three months, where it is quite possible the bottom for the 2022-23 earnings recession will shift to the first quarter of 2023.
Reference
Silverblatt, Howard. Standard & Poor. S&P 500 Earnings and Estimates. [Excel Spreadsheet]. 15 February 2023. Accessed 17 February 2023.
Labels: earnings, recession, SP 500
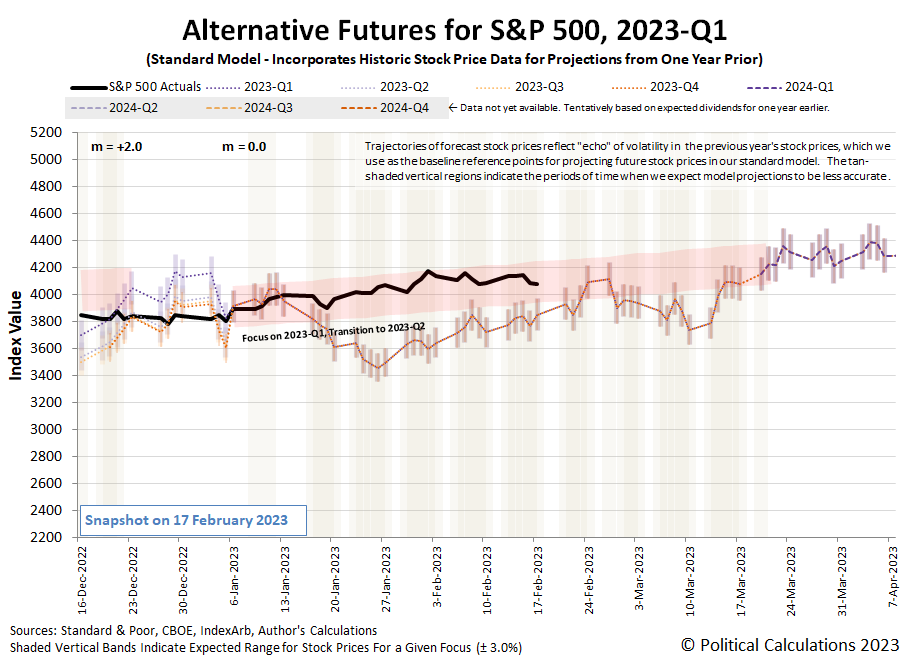
The S&P 500 (Index: SPX) retreated 0.3% from the previous week's close to reach a value of 4079.09 during the trading week ending on Friday, 17 February 2023. That puts the index 15% below its record high peak of 4,796.56 set back on 3 January 2022.
Picking up where we left on in last week's analysis, we've modifed our assessment for when the latest shift in the dividend futures-based model's multiplier occurred. We're now looking at Friday, 6 January 2023 as the date marking when the multiplier changed from +2.0 to roughly zero, based on how stock prices behaved in the weeks leading up to and in the weeks since that date.
The latest update to the alternative futures chart shows how it looks after updating it to account for the apparent change in market regime at that time.
The question now is what changed around that time to cause the change in market regime?
The need to periodically have to answer questions like this is why we make a point of documenting the market-moving news headlines of the week. Here are the previous editions of our ongoing S&P 500 chaos series that overlap this period. Here are the relevant editions:
- The S&P 500 Ends 2022 Back in Bear Territory (Trading week ending 3 January 2023)
- 2022's Volatility Continues Into 2023 for the S&P 500 (Trading week ending 10 January 2023)
- Brightening Outlook for 2023 Dividends Boosts S&P 500 (Trading week ending 17 January 2023)
The biggest potential needle mover we see in the headlines over this period is the end of the Chinese government's zero-COVID lockdowns following popular protests. Given China's role as a major producer of goods consumed in other countries and the economic disruption its failed three-year old policy was having on global supply chains, the sudden change in its government's policy would have global impact as details of the lifting of its lockdowns became known. Much like how the onset of 2020's coronavirus pandemic initially triggered the first change we ever observed in real time of the dividend futures-based model's multiplier, it would make sense that the end of the Chinese government's economically destructive COVID response would be accompanied by another shift in the multiplier.
Before we move onto other topics, what we've just described is a working hypothesis that may be adapted or even dropped as we get more and better information. Stock prices are influenced by a lot of moving pieces and there are many other factors that are also at work at any given time. To filter through the noise to develop this hypothesis, we're not just looking for the potential to cause a change in market regime, but also for factors that aren't regularly present in the market because historical data suggests such regime changes do not happen often. We think any successful competing hypothesis would have to likewise meet that requirement.
One way we can check the hypothesis is to see what happened with expected future dividends in response to the new information. Positive dividends would be expected to arise from the end of China's zero-COVID lockdowns and their disruptive effect on supply chains. And quite literally, they have. As touched on in the older editions of the S&P 500 chaos series highlighted above, the outlook for the S&P 500's dividends have brightened considerably in the weeks since the market regime changed. We'll take a closer look at when and how much they changed later this week.
Here are the market moving headlines of the week that just was, which may someday be useful to return to for reference weeks or years from now....
- Monday, 13 February 2023
-
- Signs and portents for the U.S. economy:
- Oil edges higher as market weighs Russian supply cuts amid demand fears
- U.S. companies face more pain as expected ‘earnings recession’ looms
- Egged on by economists, Fed minions say they're ready to hike interest rates higher:
- At least two more Fed rate hikes and no cut this year, say economists
- Fed's Bowman says more interest rate hikes needed to tame inflation
- BOJ minions meet the new boss:
- At BOJ's helm, MIT-educated Ueda to put theory into practice
- Shock BOJ appointment sparks rush for Japanese economist's obscure texts
- BOJ's expected new chief Ueda to let data guide exit timing- ex-staff
- Weighing up Ueda, investors cool on hawkish BOJ bets
- Japan's weak Q4 GDP rebound poses challenge for BOJ's exit path
- ECB minions identify who they see as losers:
- Wall Street ends sharply higher as investors eye inflation data
- Tuesday, 14 February 2023
-
- Signs and portents for the U.S. economy:
- Rents push up U.S. consumer prices; inflation gradually cooling
- Oil prices dip on U.S. crude reserve release, inflation pressure
- U.S. small business sentiment improves in January - NFIB
- Fed minions keep door open to peak policy rate above 5.1%
- Fed's Williams says more rate rises needed to control high inflation
- Fed not yet done on hikes but likely close, Harker says
- Fed must be ready to hike rates for longer than now expected, Logan says
- Fed looks to services prices as last leg in inflation fight
- Bigger trouble developing in Eurozone:
- German wholesale price index up 10.6% y/y in January
- German housing shortage hits highest level in 20 years - ZIA
- Central banks expected to gear up for last rate hikes before pausing:
- ECB minions upset by high employment:
- Wall Street ends mixed as inflation data supports rate worries
- Wednesday, 15 February 2023
-
- Signs and portents for the U.S. economy:
- Bigger stimulus developing in China:
- ECB minions thinking Eurozone inflation may fall faster than they think, bigger rate hikes expected:
- Euro zone inflation could fall faster than thought, ECB's De Cos says
- ECB 50-basis-point hike in March a done deal, May and June undecided: Reuters poll
- S&P 500 ends higher after strong retail sales data
- Thursday, 16 February 2023
-
- Signs and portents for the U.S. economy:
- U.S. single-family housing starts, building permits tumble in January
- Philadelphia Fed manufacturing gauge plunges unexpectedly
- U.S. labor market still tight; monthly producer inflation accelerates
- Fed minions want more rate hikes:
- Bigger stimulus developing in China:
- Central bank minions starting to put rate hikes on hold:
- ECB minions thinking about smaller rate hikes, don't think they've had much effect, may need a new plan, and worry about their credibility:
- ECB's Panetta calls for small rate hikes as inflation falls
- ECB says rate hikes have yet to be felt, even as more loom
- Analysis-ECB faces new communication challenge as inflation falls
- ECB's Makhlouf says long way to 2% target; credibility 'at risk'
- Wall Street ends down sharply as data fuels rate-hike worries
- Friday, 17 February 2023
-
- Signs and portents for the U.S. economy:
- Fed minions not seeing data they want to see, say that makes them want to hike rates more:
- More Fed policymakers point to higher rates in inflation fight
- Barkin: Not much signal in recent elevated jobs, retail numbers
- Bigger stimulus causing bigger trouble in China:
- Bigger trouble developing in the Eurozone:
- German producer prices ease, but at lower pace than expected
- Germans worry about inflation, say it causes financial pain - survey
- BOJ minions have inflation, new boss to worry about:
- Japan consumer inflation rate seen accelerating to over 41-year high: Reuters poll
- With Japan's new central bank boss, Kishida bids farewell to Abenomics
- ECB minions looking forward to more rate hikes and no rate cuts in 2023:
- Hawkish ECB comments push up rate-hike expectations
- ECB's Villeroy sees summer rate peak, no cut this year
- S&P 500 ends down as investors fret about interest rates
The CME Group's FedWatch Tool continues to project a quarter point rate hike at the Fed's upcoming 22 March (2023-Q1) meeting, followed by another at its 3 May (2023-Q2) meeting. After this week however, it now projects another quarter point rate hike at the Fed's 14 June (2023-Q2) meeting, with rates topping out in a target range from 5.25%-5.50%. After that, the FedWatch tool anticipates the Fed will hold rates steady until 13 December 2023 (2023-Q4), when it projects a quarter point cut.
The Atlanta Fed's GDPNow tool's projection for real GDP growth in the first quarter of 2023 rose to +2.5% from its previous +2.2% estimate. The so-called "Blue Chip consensus" forecast still predicts a growth rate of less than +1.0%, and quite possibly a negative real GDP growth rate for 2023's first quarter.
When you hear the name Samsung, your first thought likely turns to the innovative electronic products that have made the Korean company a global success. You may also be familiar with the company as a producer of home appliances, where its track record is much less stellar.
But unless you live in South Korea, there's one innovative product that Samsung has designed, developed, and produced that you probably would never associate with the company: fire extinguishers. What makes Samsung's product offering in this category of consumer household goods remarkable is that the company's designers have done some amazing out of the box thinking to create a product unlike anything else on the market: the Firevase.
The team Samsung commissioned to develop the product really did their homework to identify why the more traditional fire extinguisher we all know wasn't being more widely adopted and used successfully to put out fires in South Korea. The following short video starts with highlighting the pain points for storing these established fire extinguishers that will be immediately familiar to anyone who has one:
As you can see in the video, the main problem with the traditional fire extinguisher is its design. They were designed and developed for use in industrial settings, which are far different from residential settings. Because that's the case, there are no good, convenient places to store a traditional fire extinguisher in a home. Instead, they often get stashed away, out of sight. That puts barriers in the way of their being used, and worse, shrinks the amount of time a fire extinguisher can be used most effectively: immediately after a fire has started.
Samsung's approach in developing the Firevase directly addresses that issue. Instead of something that gets crammed into a kitchen cabinet, their concept fits out in the open. More importantly, because it is stored out in the open where it is easily accessible, homeowners can respond to fires while they are still able to be most easily contained.
To the best of our knowledge, the Firevase as conceived by Samsung's design team is not available outside of South Korea. The company appears to have only made a limited run of the product, mainly as part of a general awareness campaign. We're writing about it today because we came across it while researching another fire extinguisher concept whose designer identified the same problems for residential users the Firevase's design team did. That product will be featured in Part II!...
Update: One of our readers paid close attention to Samsung's promotional video and what they saw raises a good question about how capable the Firevase might be at putting out fires:
Seems like Samsung might have a good idea - if only they had shown the extinguisher actually extinguishing a fire. The 3 examples that they show at 2:22 to 2:25, do not show the fire going out. They prematurely stopped the video from showing that for all three.
That may be exactly why the Firevase never made to the marketplace. There are however other products similar to it in concept that have, but which raise similar questions about their fire-fighting capabilities. For more about some of those products, check out TylerTube's video putting them to the test!
Labels: technology
China is, by a very wide margin, the world's leading producer of carbon dioxide emissions. No other nation has ever put as much carbon dioxide into the Earth's atmosphere in a single year as China. That includes the United States, the world's second largest producer of carbon dioxide emissions.
These statements are based upon data provided by Global Carbon Project for 2022, which reports historical data for national fossil fuel-based emissions of carbon dioxide from 1850 through 2021. In that most recent year, China added some 3,131 metric tonnes of carbon (MtC) to the Earth's atmosphere, while the U.S. added 43% of that amount. U.S. carbon dioxide output peaked in 2005 at 1,675 MtC and has generally fallen in the years since, while China surpassed that level in 2006 and has continued to increase its CO₂ emissions each year.
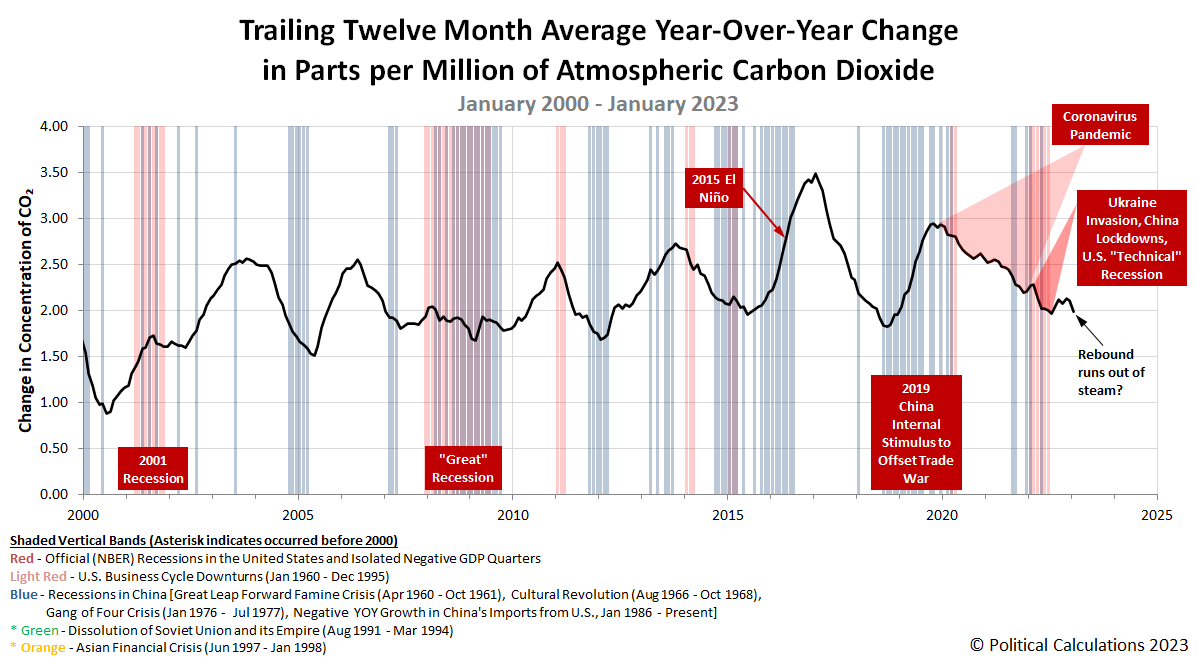
We're making a point of highlighting China's outsized role in contributing to global carbon dioxide emissions because its shows up in measurements of the concentration of carbon dioxide in the Earth's atmosphere, which increasingly tells us quite a lot about the state of China's economy. In February 2023, those measurements provide more evidence that the Chinese government's zero-COVID lockdowns during the final three months of 2022 negatively impacted its economy.
Changes in China's economic growth drive changes in the country's CO₂ emissions, which are typically reflected in atmospheric concentration data measured at high-elevation observatories on the big island of Hawaii some 4-6 weeks later after they've fully diffused into the Earth's air. What that data indicates is that China's zero-COVID lockdowns, which were ramped up during the fourth quarter of 2022, effectively reversed much of the third-quarter's rebound.
Looking forward, we should see the pace at which CO₂ accumulates in the atmosphere reverse once again and start to increase. That change will coincide with increased economic output in China following its government's complete reversal of its zero-COVID policy and its lifting of lockdowns at the end of December 2022.
References
National Oceanographic and Atmospheric Administration. Earth System Research Laboratory. Mauna Loa Observatory CO2 Data. [Text File]. Updated 6 February 2023. Accessed 6 February 2023.
Global Carbon Project. (2022). Supplemental data of Global Carbon Budget 2022 (Version 1.0) [Data set]. Global Carbon Project. DOI: 10.18160/gcp-2022.
Labels: economics, environment
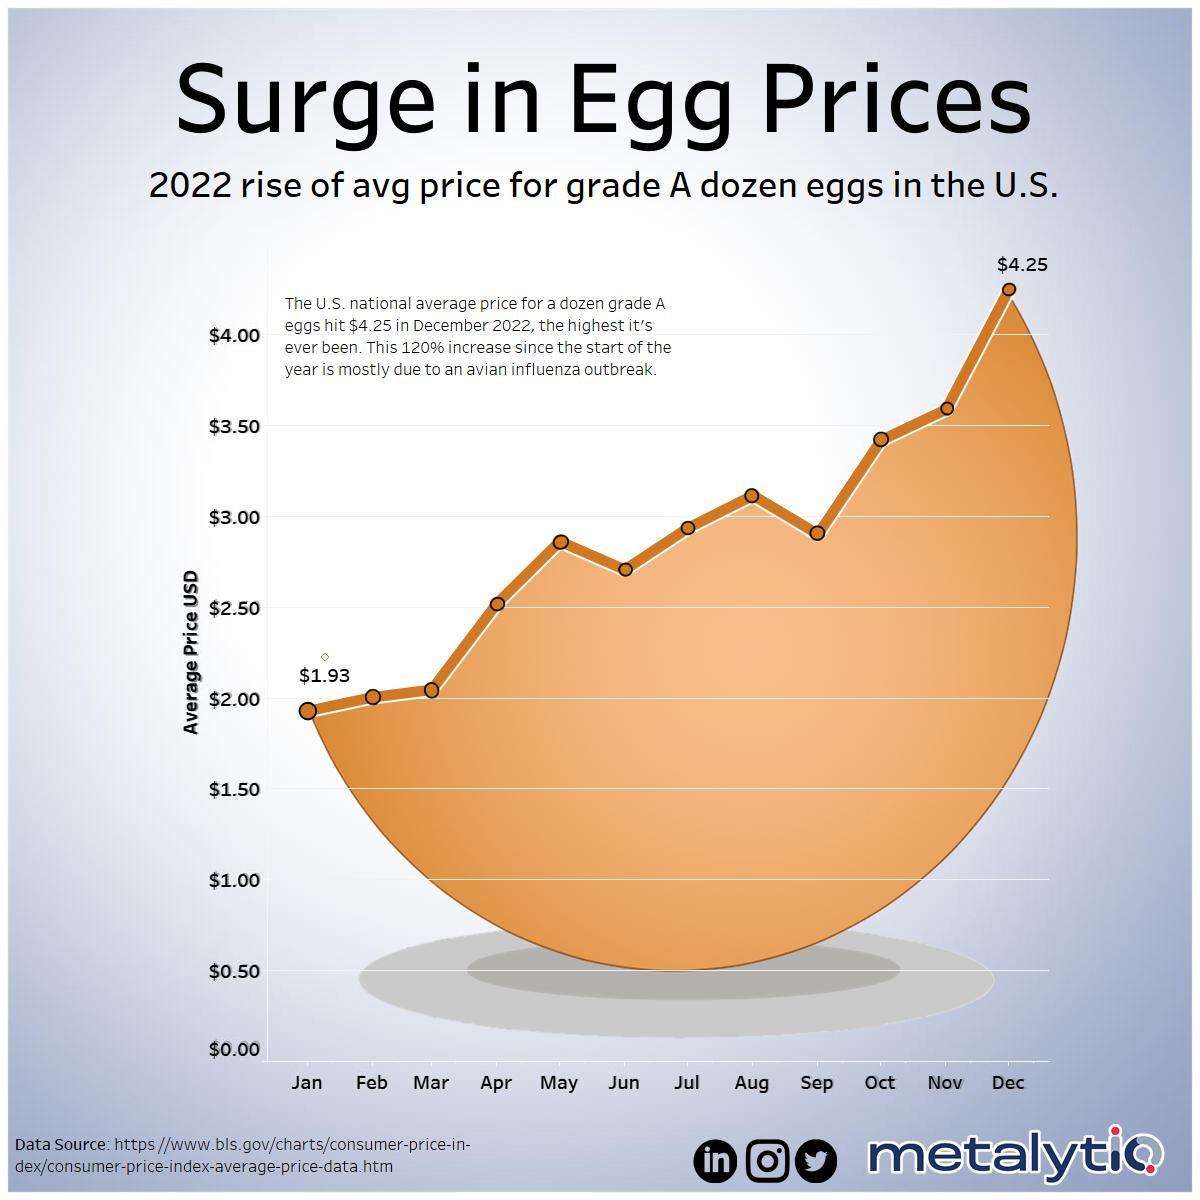
Consumer price inflation came in hotter than expected in January 2023. While the rate of inflation has moderated since peaking at 9.1% in June 2022, the prices of many goods are still rising quite rapidly. Especially eggs, whose price rise during 2022 was illustrated very well by metalytIQ:
If metalytIQ's chart extended into January 2023, it would show the average price for a dozen Grade A eggs in the U.S. rising to $4.83. Since eggs represent one of the least expensive and most popular sources of protein for Americans, that's a very big deal.
Unlike most products affected by President Biden's COVID-stimulus fueled-inflation, the rising price of eggs has been driven by a devastating tragedy. The spread of H5N1 Highly Pathogenic Avian Influenza (a.k.a. the 2022 bird flu) has led the culling of over 58 million birds in the U.S., including over 40 million table egg-laying hens at commercial farms.
That's nearly one out of eight of the U.S. estimated population of 323 million table egg-laying population of chickens in January 2022. That may sound like much, but eggs are a food product with very few acceptable substitutes, so demand for eggs has remained elevated, even though the supply has shrunk considerably. Since the prices for goods like eggs are set at the margin, that combination of demand and supply has produced an outsized increase in the price consumers pay for eggs.
How much longer might that last?
Since a negative change in supply produced such a large increase in the price of eggs, it stands to reason that a positive change in supply can reverse it. If we know how long it might take the commerical table-egg producing farms to recover from the loss of their flocks, we can project when the rising price of eggs might break.
We tapped a number of sources to put together the following basic timetable for resuming full egg production after an outbreak of the H5N1 influenza virus has been detected in a farm's population of chickens.
- Day 0: Viral infection is detected within a farm's flock.
- Day 1: The entire farm's flock is culled.
- Week 1: The disinfection of the farm's facilities is completed.
- Week 4: The farm's facilities have tested clear of infection for a full three weeks.
- Weeks 4-8: A new population of chicks is introduced.
- Week 30: The first small eggs start being laid.
- Week 36: Eggs being laid reach their "full" size for commercial production.
- Week 38: Hens reach their peak frequency for laying eggs.
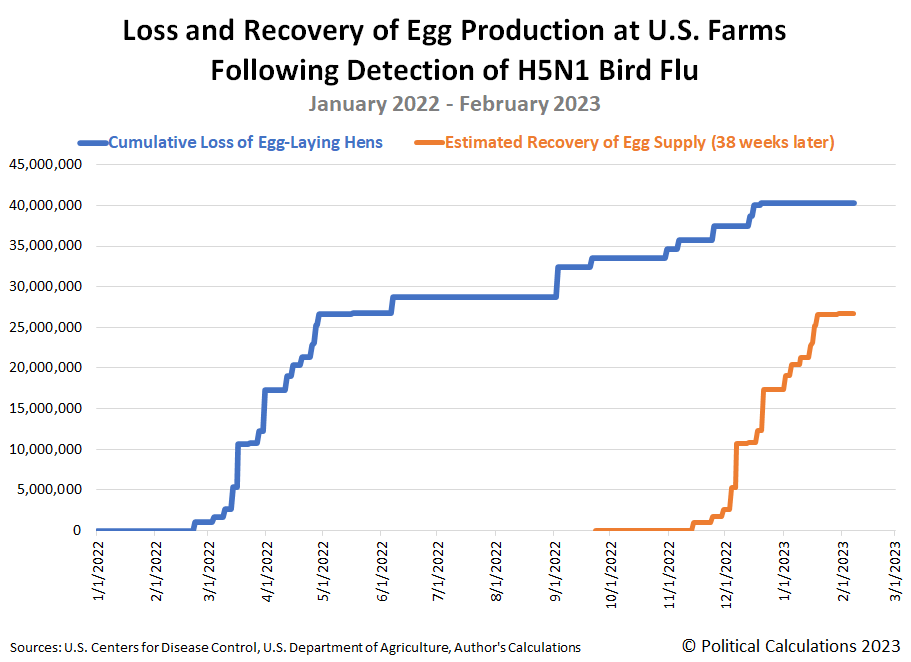
Now, we've taken the CDC's data for when the H5N1 bird flu was first detected at commercial table-egg producing farms during 2022 and have projected when the recovery in supply would occur if all goes according to that timetable. The following chart shows the results:
Based on that 38 week recovery time, our back of the envelope timetable would predict that the egg supply would begin recovering in early December 2022, with a fairly robust recovery through January 2023. That scenario would coincide with the commercial farms that were first to be negatively impacted by the 2022 bird flu coming back online after repopulating their egg-laying flocks.
We can check the our egg supply recovery projection using wholesale egg prices, or rather, the prices paid by the firms in between the farms and grocery store consumers. For that data, we pulled the Urner Barry Egg Index shortly after it was updated through 13 February 2023:
Note the wholesale price of eggs starts spiking upward beginning in March 2022, just after the first major outbreaks of H5N1 bird flu at several large commercial egg-producing farms. Flashing forward, we see the wholesale prices of eggs in the U.S. peaked on 19 December 2023, which is close but is some 2 to 3 weeks after our timetable would predict. Since 19 December 2023, the wholesale price of a dozen eggs has dropped from $4.63 to $1.91 as of 13 February 2023.
The price of eggs tracked in the Consumer Price Index for January 2023 is based on prices that applied during the week of 12 January 2023. Assuming a lag of about four weeks for changes in wholesale prices to impact retail prices, we think it's quite possible January 2023 saw the peak in the retail price of eggs for American grocery shoppers. As you're reading this, the rising price of eggs has most likely already broken, with lower egg prices soon to show up at your local grocery store if they haven't already.
References
U.S. Bureau of Labor Statistics. Graphics for Economic News Releases. Average price data (in U.S. dollars), selected items (Eggs, grade A, large, per doz.). [Online Application]. Accessed 14 February 2023.
U.S. Centers for Disease Control. H5N1 Bird Flu Detections across the United States (Backyard and Commercial). Data Table. [CSV Data]. Accessed 14 February 2023.
Urner Barry. Urner Barry Egg Index. [Online Application]. 13 February 2023. Accessed 13 February 2023.
Previously on Political Calculations
Believe it or not, we have covered the economic effects of bird flu on agricultural goods before! Here's a sampling of that coverage in chronological order, which mainly focuses on the impact of 2015's bird flu epidemic on U.S. farm-raised turkeys:
- No, the U.S. Has Not Hit "Peak Turkey" (2015)
- Almost the Year Without Enough Turkey for Thanksgiving (2016, discussing 2015)
- Turkey Shrinkflation (2022)
Mostly off topic, here's where we purposefully featured articles involving eggs!
Labels: economics, food, inflation
Welcome to the blogosphere's toolchest! Here, unlike other blogs dedicated to analyzing current events, we create easy-to-use, simple tools to do the math related to them so you can get in on the action too! If you would like to learn more about these tools, or if you would like to contribute ideas to develop for this blog, please e-mail us at:
ironman at politicalcalculations
Thanks in advance!
Closing values for previous trading day.
This site is primarily powered by:
CSS Validation
RSS Site Feed
JavaScript
The tools on this site are built using JavaScript. If you would like to learn more, one of the best free resources on the web is available at W3Schools.com.


