
Last year, we inaugurated our annual celebration of The Biggest Math Story of the Year, where we sought out the most significant story to rock the world of mathematics in 2014. This year, we're back to consider the biggest math-related stories in 2015 that have the real potential to impact our everyday lives!
That's an important distinction to make, because otherwise, we'd have to consider stories like Homer Simpson's discovery of the Higgs Boson, which became news in 2015, some two years after the particle itself was confirmed to exist when someone finally watched an old episode of The Simpsons and realized that the cartoon character had done the math back in 1998.
That distinction also affects the ongoing story of Shinichi Mochizuki's extraordinarily complex proof of the abc Conjecture from back in 2012, which has yet to be substantiated. The proof is so challenging, in fact, that it now occupies the status of being the biggest mystery in mathematics! If and when Mochizuki's proof is ever substantiated, or even if it comes up short, that story could very well be the biggest math story of the year. But for now, all we know is that it is not the biggest math story of 2015.
As for what that story is, well, it could have quite a bit to do with the intersection of the worlds of math, robotics and artificial intelligence, where stories of Google's accident prone self-driving cars could soon be shaping the near term future of everyday life and commerce.
But the rise of automation technology is an old story - one that's been told now for centuries. Just because computer processing and sensor technology has advanced to the point where we can successfully program computers to outperform human drivers or even movie critics doesn't necessarily make that story the biggest math story of the year.
Unless you've been living under a rock, you probably heard the term "income inequality" at some point of 2015. What you likely haven't heard is that a team of researchers at Tel-Aviv University developed a mathematical model that suggests that the increase in wealth inequality in recent years might be able to be reversed.
For many Americans, the single biggest problem facing the country is the growing wealth inequality. Based on income tax data, wealth inequality in the US has steadily increased since the mid-1980s, with the top 10% of the population currently owning about 73% of the country's wealth. In a new paper published in PLOS ONE, researchers have quantitatively analyzed several of the major factors that affect wealth inequality dynamics, and found that the most crucial factor associated with the recent surge in wealth inequality since the '80s has been the dramatic decrease in personal savings, followed closely by a large increase in the dominance of capital income over labor income.
Taking these findings a step further, the researchers showed in their model that reversing these two trends can prevent and even reverse a further increase in wealth inequality in the future. The researchers hope that the findings will lead to policies that reproduce these results in the real world. But progress in this area may not even have to rely solely on policy changes, as the researchers note that the 2008 financial crisis has caused Americans to save more money, potentially bringing an opportunity to restrain some of the growth in wealth inequality.
Problem solved, right? Just a little prolonged financial crisis will fix all that's wrong in the world with income and wealth inequality!
Aside from sloppy thinking ("here, you'll be completely cured if you completely swallow this poison-filled pill that will fill your remaining life with pain"), the problem here is that the Israeli researchers may not have modeled the problem properly, leading them to an incorrect conclusion. A new paper by Dean Baker rejects the capital-over-labor income as the major driver of inequality, finding instead that outsize economic "rents" within the labor income earned via patents and copyrights, within the financial sector, within the limited pool of CEOs and executive and more broadly by professionals in general are responsible for much of the perceived increase in income inequality.
And since it's not clear at this point which story is the right one, the Israeli researchers' "solution" to income inequality is nowhere near close to being the biggest math story of the year.
Nor are the elaborate mathematical equations that were developed by the European Union's bureaucrats for determining how many migrants from the Middle East that each nation of the EU would be required to take in. While the inundation of European nations by millions of migrants is indeed the biggest news story of 2015, the truth is that the math failed, as many nations within Europe had their limited resources overwhelmed, forcing them to rethink the commitments they made to accept them.
A better candidate for the biggest math story of the year is the work of four mathematicians that promises to bridge number theory and geometry. Here, Xinyi Yuan, Wei Zhang, Zhiwei Yun and Xinwen Zhu combined to address the arithmatic fundamental lemma.
In December 2014, Zhang flew from New York to the West Coast, where he saw Yun and Yuan. The reason for the trip was a 60th-birthday conference at the Mathematical Sciences Research Institute in Berkeley for the Columbia mathematician Michael Harris, but Zhang also arrived with an idea he wanted to share with his friends. That idea had grown out of a conversation he’d had with Yun back in 2011. At that time, Yun had been thinking about work Zhang had done even earlier on a problem in the Langlands program known as the arithmetic fundamental lemma. Yun thought that some of those ideas could be combined with techniques from algebraic geometry, but he told Zhang he wasn’t sure if it was possible....
They left the conversation there for several years. Then in 2014, Zhang realized that Yun’s intuition was correct, and he began to see what it would take to prove it. The problem at hand involved L-functions, which Zhang had studied in graduate school. L-functions have what’s known as a Taylor expansion, in which they can be expressed as a sum of increasing powers. In 1986 Benedict Gross and Don Zagier were able to calculate the first term in the series.
Although L-functions were initially purely objects of number theory, they can also have a geometric interpretation, and powerful techniques from algebraic geometry can be used to study them. Yun had guessed that every term in the Taylor expansion should have a geometric interpretation; Zhang was able to precisely define what such an interpretation would look like. Whereas Gross and Zagier (and the French mathematician Jean-Loup Waldspurger) had been able to obtain exact formulas for the first and second term in the expansion, the new work would show how to obtain a geometric formula for every term.
[...]
The result still has to go through peer review, but it is already generating excitement in the math world. Among other implications, it opens a whole new window onto the famed Birch and Swinnerton-Dyer conjecture, which is one of the seven Millennium Prize Problems that carry a $1 million award for whoever solves them first.
From a practical perspective, should the proof hold and be useful in unlocking the Birch and Swinnerton-Dyer Conjecture, it will have an impact on building better cryptographic and coding systems.
In a really perverse way however, sometimes the knowledge that you cannot solve a problem is extremely useful, which brings us to our next math story, where a mathematical paradox makes a physics problem unanswerable.
A logical paradox at the heart of mathematics and computer science turns out to have implications for the real world, making a basic question about matter fundamentally unanswerable.
In 1931, Austrian-born mathematician Kurt Gödel shook the academic world when he announced that some statements are ‘undecidable’, meaning that it is impossible to prove them either true or false. Three researchers have now found that the same principle makes it impossible to calculate an important property of a material — the gaps between the lowest energy levels of its electrons — from an idealized model of its atoms.
The result also raises the possibility that a related problem in particle physics — which has a US$1-million prize attached to it — could be similarly unsolvable, says Toby Cubitt, a quantum-information theorist at University College London and one of the authors of the study.
The finding, published on 9 December in Nature, and in a longer, 140-page version on the arXiv preprint server2, is “genuinely shocking, and probably a big surprise for almost everybody working on condensed-matter theory”, says Christian Gogolin, a quantum information theorist at the Institute of Photonic Sciences in Barcelona, Spain.
So what does knowing that a problem is "undecidable" do for a mathematician?
For starters, because it specifically applies to the deductive approach being taken to make some sort of determination in solving a problem, it allows the mathematician to dispose of the approach as a dead end rather than continue wasting their efforts upon it. Knowing with certainty what's not going to work then can be especially valuable in directing their work to more viable approaches.
That's close to being the biggest math story of the year, but we'll admit that we're biased in preferring stories that end with solutions being obtained over stories where they're not. And that brings us to the next story, in which it appears that the graph isomorphism problem may be on the verge of moving from being an almost insoluable NP problem to being a very solvable P problem instead.
A theoretical computer scientist has presented an algorithm that is being hailed as a breakthrough in mapping the obscure terrain of complexity theory, which explores how hard computational problems are to solve. Last month, László Babai, of the University of Chicago, announced that he had come up with a new algorithm for the “graph isomorphism” problem, one of the most tantalizing mysteries in computer science. The new algorithm appears to be vastly more efficient than the previous best algorithm, which had held the record for more than 30 years. His paper became available today on the scientific preprint site arxiv.org, and he has also submitted it to the Association for Computing Machinery’s 48th Symposium on Theory of Computing.
For decades, the graph isomorphism problem has held a special status within complexity theory. While thousands of other computational problems have meekly succumbed to categorization as either hard or easy, graph isomorphism has defied classification. It seems easier than the hard problems, but harder than the easy problems, occupying a sort of no man’s land between these two domains. It is one of the two most famous problems in this strange gray area, said Scott Aaronson, a complexity theorist at the Massachusetts Institute of Technology. Now, he said, “it looks as if one of the two may have fallen.”
Babai’s announcement has electrified the theoretical computer science community. If his work proves correct, it will be “one of the big results of the decade, if not the last several decades,” said Joshua Grochow, a computer scientist at the Santa Fe Institute.
This is a big, big deal! Before we go further though, let's consider what we're talking about when we throw fancy words like "graph isomorphism" around:
Computer scientists use the word “graph” to refer to a network of nodes with edges connecting some of the nodes. The graph isomorphism question simply asks when two graphs are really the same graph in disguise because there’s a one-to-one correspondence (an “isomorphism”) between their nodes that preserves the ways the nodes are connected. The problem is easy to state, but tricky to solve, since even small graphs can be made to look very different just by moving their nodes around.
Babai's algorithm is a major step forward because it promises to move an entire class of problems into the arena of problems that can be solved within a reasonable amount of time. Even with the limitation that the new algorithm cannot successfully address the special case of supersymmetry in nodal structures, it still offers tremendous opportunity for practical applications.
What applications? Just consider the following short and incomplete list of what can become possible if you're able to determine that two graphs share the same nodal structure:
- Biometric recognition and identification
- Geographic pattern recognition
- Identification of chemical compounds
- Optimization of routes (travel, electronic circuit design, etc.)
- Clustering applications - identification of networks or groups with similar properties or behaviors (social groups, criminal networks, etc.)
The development of the nearly comprehensive graph isomorphism algorithm is the biggest math story of 2015!
This is our final post for 2015. We'll be back early in 2016 with the next edition of our paycheck withholding tool. Until then, we'll leave you with one last math story for the holidays - how to send everyone home from your Christmas celebration a winner in the grand tradition of Christmas cracker pulling:
In the traditional approach, all dinner guests sit around the table, cross arms, and pull crackers with their two immediate neighbors. In this approach, each person has a 25% chance of winning zero crackers, so there are clearly inefficiencies in the system.
A better approach would be to use a system that starts by pairing up individuals and having each pair pull a single cracker. (For odd-sized groups one individual will have to stir the gravy or check the goose while this takes place.) Exactly [N/2] crackers are used in this round, with the same number of winners and losers.
Those who have not yet won continue as before until only a single individual remains. That individual then pulls a cracker with themselves and we are done.
Have a Merry Christmas and Happy New Year!

Labels: math
Are you not anywhere near as capable as you make yourself out to be? If so, you might have a problem, and potentially a really big problem.
How big a problem that may be depends upon several factors:
- What are the consequences if you continue? Do you face impending doom?
- How competent do the people you work with think you are?
- How competent do you really need to be to do what you do?
- How competent are you really?
- How good are you at faking being competent?
- How long have you been faking being competent?
Geek Logik author Garth Sundem has considered these questions, and describes how they might come into play in a work setting:
On your resumé it states "expert in protein-structure analysis," a phrase you heard once on the Discovery Channel. Originally, you though it did a good job of filling the white space under "other skills" and never thought your knowledge of crystallography would be tested while you were working at Blockbuster. But now your manager wants you to categorize this month's new movies based on their homologous superfamily and/or CATH designation and you're thinking "online gaming" would have been a beter choice as resumé filler. However, you're pretty sure your manager can't tell an orthogonal prism from an alpha solenoid, so you might get away with faking it. On the other hand, someone likely had this same thought just before the Chernobyl nuclear disaster.
Clearly, this is the kind of situation that would only arise if you lacked the integrity to be honest about your capabilities in the first place. But since you already have problems with your integrity, you now have a choice: should you continue your bluff or should you finally come clean and admit your incompetence before things spiral out of control for you?
Fortunately for you, Garth Sundem has put those ethical questions into algebraic form, which we've turned into a tool to do the math for you! All you need to do is to rank yourself on each of the following questions, which Garth has expressed by incorporating a more serious surgical scenario, and we'll help you determine how you'll deal with the problem that is entirely of your own making.
If you're reading this article on a site that republishes our RSS news feed, click here to access a working version of this tool!
At this point, we can't help but think of Dave Foley's classic comedic performance in "The Doctor" sketch from the Kids in the Hall:
While these scenarios may seem far fetched, the truth is they are all too common, as the lack of meaningful consequences encourages the unethical behavior. Just consider the case of the less than capable econometrician who effectively made themselves into the economics equivalent of a climate change denier just so they could both avoid losing face and sustain their error-laden, invalid, pseudoscientific analyses, or the more serious cases of the Environmental Protection Administration's top climate expert who claimed to be a spy for the CIA for a decade, or the phony records that allowed the staff of the Department of Veterans Affairs to claim big bonuses for providing care they never delivered.
This tool is for them!
Guest post contributed by Alec Chìnn.
Labels: geek logik, tool
One week ago, we described the pace of U.S. companies announcing that they would be cutting their cash dividend payments to their shareholders as being between "slow-to-slowing growth and contraction".
There's no in-between any more. Over the last week, the pace of dividend cut announcements has ramped up to where they have reached levels that are consistent with economic contraction occurring within the U.S. economy.
Our first chart shows that result with respect to the trajectories that dividend cut announcements took in each the previous quarters in 2015:

A week ago, we also noted that the pace of dividend cuts in 2015-Q4 had been tracking along pretty closely with the pace at which dividend cut announcements arrived a year earlier, in 2014-Q4. That's no longer true, as 2015-Q4 has clearly taken a sharp turn for the worse.

In this second chart, which is based only upon data from the WSJ's Dividend Declarations database, we can confirm that the picture for 2015-Q4 is actually worse than it appears, as the WSJ's database has missed some very prominent dividend cuts that have taken place during the current quarter, such as those for Kinder Morgan, Freeport McMoran, and three of the Teekay family of traded companies, despite the Wall Street Journal itself carrying articles announcing the cuts. (If you work at the WSJ, you might want to see about fixing that problem....)
Finally, if you recall, 2014-Q4 was a quarter defined by slowing growth ahead of the dismal economic performance of 2015-Q1. 2015-Q4 is shaping up to be a worse quarter for growth than 2014-Q4 - at least if the near real time relative economic health indicator of the number of dividend cuts is any indication.
Data Sources
Seeking Alpha Market Currents. Filtered for Dividends. [Online Database]. Accessed 21 December 2015.
Wall Street Journal. Dividend Declarations. [Online Database]. Accessed 21 December 2015.
Once upon a time, the only way that sailors crossing oceans could know if they were on course to their destinations required them to know what time it was. Verna Allee described the problem in The Knowledge Evolution:
In the Age of Exploration [1300-1600 AD] competitive advantage resided with those who had the best ability to navigate the globe. Those countries that ruled the seas--ruled the world. In those days, they found the great challenge in navigation is finding a way to tell time at sea. Unless you know what time it is, you cannot determine longitude. So, you see, in order to master space and thus circumnavigate the globe, you must first find a way to master time. A time measurement allows you to understand the relationship between the point where you are and the point where you want to be. If you understand that relationship, then you can chart a course and find your way home again....
Navigation boils down to a few simple elements: a good map, something like a sextant to tell you where you are, and a timepiece to help you measure your progress. These are good things to remember when trying to navigate:
- In order to know where you are on earth, you must first look at the stars (Shift your perspective.)
- To chart a course you must know both where you are and what time it is. (Understand the relationship of time and space.)
Once you know these things, navigation becomes a simple problem in kinematics. Where you will end up depends first upon where you are (your position), and then it depends upon your direction and speed (velocity), as well as any changes in your direction and speed (acceleration).
Stock prices work almost exactly like that, with one important difference. Because the acceleration of stock prices is directly proportionate to the change in the rate of growth of their underlying dividends per share expected at specific points of time in the future, correctly anticipating where stock prices are going to go also requires investors navigating the markets to know the specific point of time in the future to which investors are collectively heading.

What makes that such a challenge to pull off successfully is that investors can collectively shift their forward-looking focus from one specific point of time in the future to another with very little warning. When they fully shift their focus from one such point of time to another, depending upon how different the expected acceleration of dividends per share is for each, the resulting change in stock prices can vary anywhere from a little to a lot. This shift in focus is not just what gives stock prices of their volatility, but also their quantum-like properties.
And because the things, or new information, that might prompt them to shift their attention from one point of time in the future to another often comes at random intervals, the effect is to give stocks a seemingly random trajectory where they are most often characterized by small movements, as investors can sustain their focus on a particular point on the future horizon for relatively long periods of time, that are then interspersed by large movements, which come as investors suddenly shift their focus to different points of time on the horizon. Stock prices can then be said to follow a quantum random walk, which really makes forecasting their trajectory a problem in quantum kinematics.
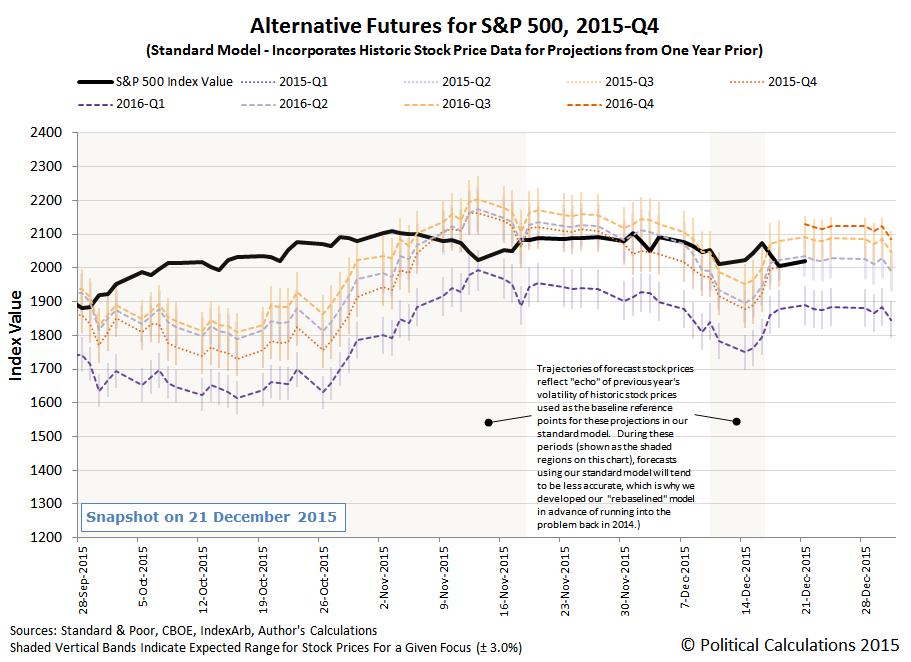
That's why competent forecasts for stock prices need to consider the potential quantum levels for stock prices based upon the rational expectations for dividends per share associated with the different points of time on the future horizon to which investors might turn their attention. Keep that in mind then when you read the following remarks, which we originally posted at 3:35 AM on Thursday, 17 December 2015 after observing that investors had just appeared to have shifted their forward-looking focus to 2016-Q3 in setting today's stock prices in response to the Fed's rate hike and Fed Chair Janet Yellen's comments the previous day:
Whenever the U.S. Federal Reserve has the full attention of investors, they give us the ability to tell how far forward investors are looking in time as they are making their current day investment decisions.
So when the Fed announced on 16 December 2015 that it would hike short term interest rates in the U.S. by a quarter percent, while also providing additional information about the likely future for additional rate hikes, we couldn't help but notice that investors would appear to have shifted their forward-looking attention to the third quarter of 2016.
For example, simply shifting their focus to 2016-Q2 before the end of 2015 would likely coincide with an approximately 3% decline in the value of the S&P 500. Meanwhile, a complete shift in forward looking focus to 2016-Q1 would correspond to a full 10% correction, with stock prices dropping by over 200 points.
But if investors stay focused on 2016-Q3, then the market is within just a percent or two of its ceiling for the remainder of the year.
After identifying the last known position of stock prices going into that trading day, we identified three very different outcomes for how stock prices would be most likely to change in the near term, all completely hinging upon whichever distinct future point of time that investors might shift their attention toward as the only differentiating factor for what the actual outcome would be.
As we expected, one of those three distinct outcomes came to pass. Conveniently for us, within two days of trading after the Fed's rate hike announcement, giving us something to write about this morning, as the value of the S&P 500 dropped by 3.3% through the close of trading on 18 December 2015....

The shift in focus to the nearer term future horizon of 2016-Q2 is more than what would be expected by just purely random chance with the stock market's typical day-to-day volatility, and yet, if we're being honest, it's not really very random at all, as perhaps the most random thing about it is the timing of its occurrence.
This will be our last post on the S&P 500 this year, where we'll wrap up 2015 sometime early in 2016, where we'll also revisit our forecasting performance during the periods of time where we relied upon our rebaselined model. Sometime later this week, perhaps as early as later today, we'll start getting dividend futures data for 2016-Q4, allowing us to consider that new point on the horizon in our forecasts.
Until then, since investors would be most likely to focus upon the three quarters preceding that distant future quarter, we've provided you with what you need to anticipate where stock prices will go next through the end of 2015, having already marked their last known position on our charts above. All you need to do now is to determine how far forward in time investors are collectively fixing their attention on the horizon to tell where stock prices will go next.
It is, after all, just a simple problem in quantum kinematics - one that anybody can solve if they understand the relationships of time and space and can shift their perspective on the future's horizons. Welcome back to the cutting edge!

Update 21 December 2015, 6:38 PM EST: Here are the current expectations for the S&P 500's quarterly dividends per share for 2016, as determined from today's recorded values for the CBOE's dividend futures contracts for the S&P 500:
2016-Q1: $11.40 | 2016-Q2: $11.45 | 2016-Q3: $11.64 | 2016-Q4: $11.77
Meanwhile, here's the updated version of our alternative futures forecast chart through the close of trading on 21 December 2015:
Still focused on 2016-Q2. At least, until that changes....
According to experts, babies and kids need fresh air. But if you live in an overdeveloped urban area, it can be hard to find an area where it is safe enough to bring your children so they can benefit. What is a mother living in the city to do if she really cares about her children's healthy development?
Fortunately, that was a problem that was solved by Emma Reed, a mother in Spokane, Washington, to whom U.S. Patent 1,448,235 was issued on 13 March 1923. Her solution? A "portable baby cage" that could be firmly placed into the windows of high rise apartment buildings!
Here's how she describes the problem and how her invention solves it:
It is well known that a great many difficulties rise in raising and properly housing babies and small children in crowded citied, that is to say from the health viewpoint. This is especially true with reference to babies and young children, who at present are being raised in large apartments, as a result of not obtaining the proper fresh air, as well as being outdoors, for such air and exercise. In crowded cities, where the houses are closely arranged, and in large apartments, there is no way for proper ventilation. Back and front yards are small, while those living in in apartments have no facilities whatever, to permit the children and babies to receive proper fresh air from the outside.
With these facts in view it is the purpose of the present invention to provide an article of manufacture for babies and young children, to be suspended upon the exterior of a building adjacent an open window, wherein the baby or young child may be placed. This article of manufacture comprises a housing or cage, wherein the baby or young child together with proper toys may be placed. The baby is enabled to receive fresh air through the screen or wire fabric, and it will be noted that the baby has sufficient room or space for playing with toys.
But wait! There's video of the invention in use!
It's the sort of thing that could only be made real by mothers who care!
Other Stuff We Can't Believe Really Exists
- Inventions in Everything: The Baby Cage
- Inventions in Everything: The Alarm Clock of Damocles
- Inventions in Everything: The Toilet Snorkel
- Inventions in Everything: Antiterrorism Barriers
- Inventions in Everything: Geothermal Beer Coolers
- Inventions in Everything: The Salmon Cannon
- Powdered Wine: Just Add Water!
- Fail: The Newest Innovation in Ice Cream
- Unlimited Virtual Legos
- Inventions in Everything: The Ultimate Turkey Blind
- Inventions in Everything: Turning Cans Into Sippy Cups
- Inventions in Everything: Anatomical Lego Figures
- It's Not What You Think....
- Inventions in Everything: Soup Bowl Attraction
- Inventions in Everything: Making Life More Difficult
- Inventions in Everything: The Oreo Separator Machine
- Air Shark!
- Markets in Everything: Stormtrooper Motorcycle Suit
- The Bike That Rides You
- One Inventor's Stick-to-itiveness
- High Five!
- Inventions for Everything
- The Best Mousetrap Ever
- An Invention for the True Wine Connoisseur
- Three of Ten Things You Don't Need on St. Patrick's Day
- The Future Just Got a Lot Cooler Than It Used to Be
- The Worst Piece of Design Ever Done
- The Magic Marker of the Future
- Coming Soon, to a Gym Near You!
Labels: technology
Whenever the U.S. Federal Reserve has the full attention of investors, they give us the ability to tell how far forward investors are looking in time as they are making their current day investment decisions.
So when the Fed announced on 16 December 2015 that it would hike short term interest rates in the U.S. by a quarter percent, while also providing additional information about the likely future for additional rate hikes, we couldn't help but notice that investors would appear to have shifted their forward-looking attention to the third quarter of 2016.
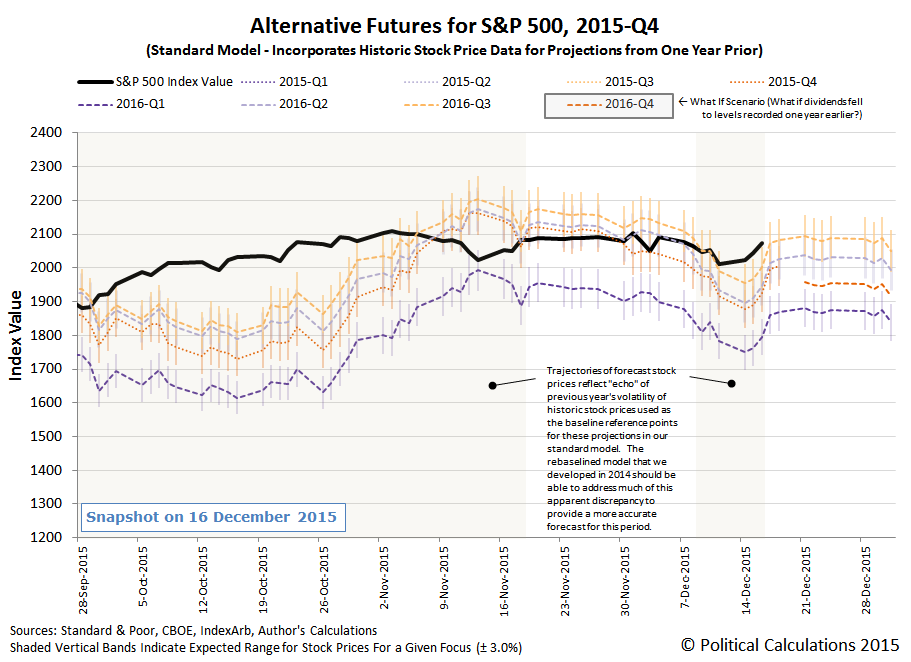
Which, when you see how it compares to all the alternative points of time in the future that investors might otherwise have chosen to focus upon, is a really dangerous place to be, as any news that would prompt investors to shift their focus to a less distant future would coincide with falling stock prices.
For example, simply shifting their focus to 2016-Q2 before the end of 2015 would likely coincide with an approximately 3% decline in the value of the S&P 500. Meanwhile, a complete shift in forward looking focus to 2016-Q1 would correspond to a full 10% correction, with stock prices dropping by over 200 points.
But if investors stay focused on 2016-Q3, then the market is within just a percent or two of its ceiling for the remainder of the year.
The one wild card is the expected future for 2016-Q4, for which we won't have data until sometime next week.
The one thing we absolutely know for sure is that investors will not turn their attention back to 2015-Q4. Although there are 16 days left before the calendar quarter officially ends, from the perspective of investors, 2015 is done.
According to the U.S. Census Bureau's monthly data on the median sale prices of new homes in the U.S., the median sale prices of new homes in the U.S. through October 2015 are at the second highest level they have ever been, having fallen from the highest they have ever been in September 2015. Not uncoincidentally, those prices have come as median household income in the U.S. has reached the highest levels it ever has during those two months. The chart below shows the relationship between the two since 1999, with monthly data from December 2000 through October 2015.
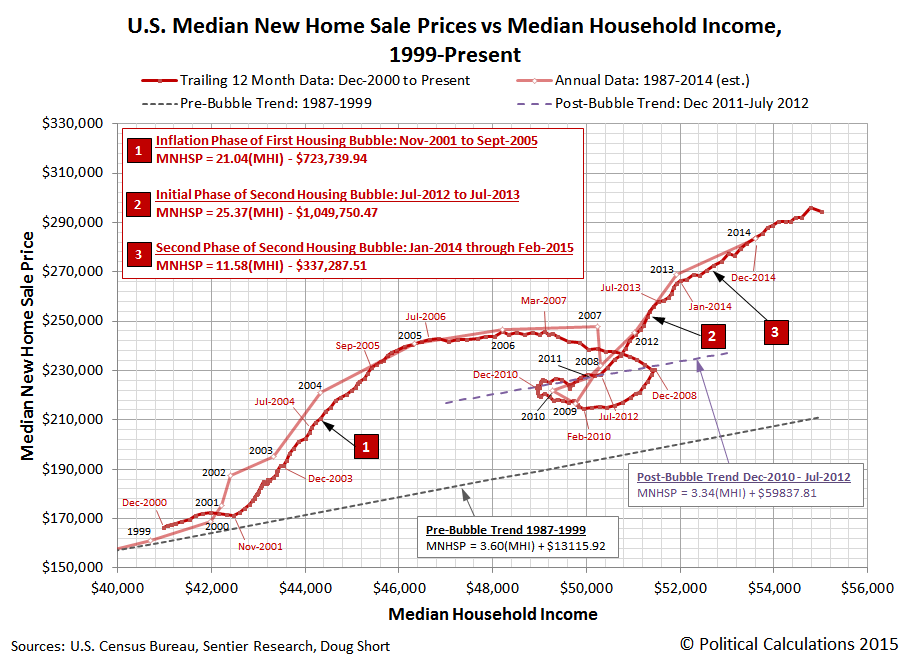
Let's zoom out next to look at the bigger picture for the relationship between median U.S. new home sale prices and median household income, looking at all the available data going back to 1967.

The median new home sale price data is typically revised by the U.S. Census Bureau at least three times in the months immediately following when it is first released, so the three most recent data points shown in the charts above are subject to change.
For those who would like to consider what the data might look like in terms of real, inflation adjusted, constant year U.S. dollars, the U.S. Bureau of Labor Statistics has a calculator where you can convert the prices provided in the data sources listed below into the terms of the U.S. dollars of the year of your choice. And if you would prefer to use monthly inflation data, the inflation adjustment math is super easy!
Data Sources
U.S. Census Bureau. Median and Average Sales Prices of New Homes Sold in the United States. [Excel Spreadsheet]. Accessed 15 December 2015.
Sentier Research. Household Income Trends: October 2015. [PDF Document]. 4 December 2015. Accessed 15 December 2015. [Note: We've converted all data to be in terms of current (nominal) U.S. dollars.]
Labels: real estate
Previously, we established that there is a rather strong correlation between changes in the acceleration of nominal private sector debt in the U.S. and the direction of growth for the nation's real GDP growth rate. In a nutshell, we found that "nearly 88% of periods in which the trailing twelve month average of private debt acceleration declined or was negative occurred when the U.S.' real GDP growth rate was falling", indicating that changes in the acceleration of private debt is a good predictor of the direction of GDP growth.
Why such a strong correlation between nominal private debt and real GDP? Unlike money borrowed by government entities, when people or businesses take out loans in the private sector of the economy, they do so only when they can reasonably anticipate that they will be able to generate the income or revenue needed to pay their creditors back over the terms of their loans. If they anticipate that they will have a hard time doing that going forward, they will avoid taking on debt, and vice versa - they will increase the rate of their borrowing if they anticipate having an easier time paying it back.
With the Federal Reserve having released its flow of funds data through the end of the third quarter of 2015 in the past week, we can now introduce our chart showing our calculated acceleration rate for private sector debt in the U.S. and its trailing year average against the backdrop of periods of falling GDP growth rates, recessions and the Federal Reserve's various Quantitative Easing (QE) programs in the period from Janaury 2006 through September 2015.
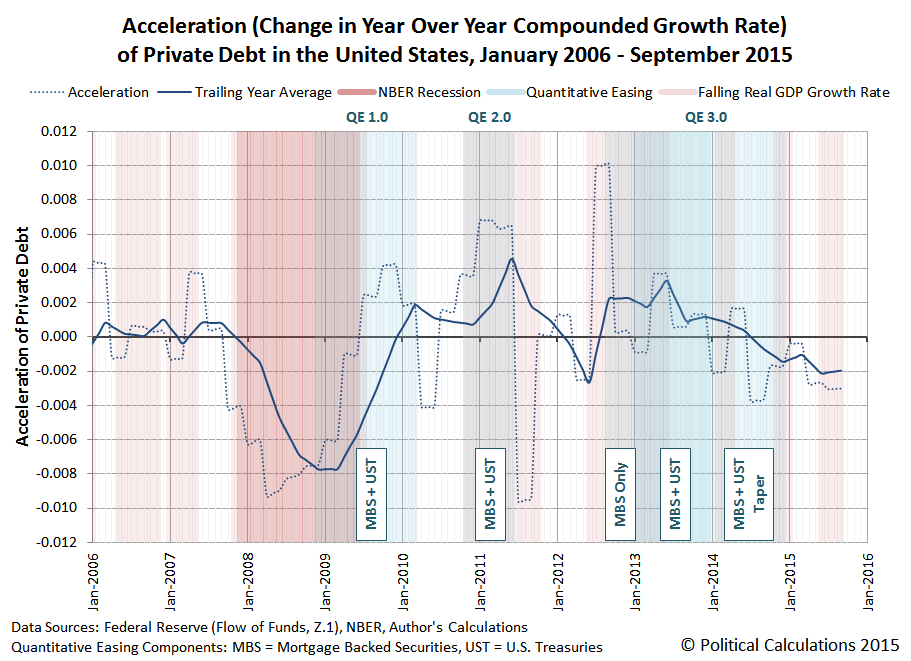
We see that in the third quarter of 2015, the acceleration of private debt in the U.S. remained negative, declining slightly from the previous quarter. Correspondingly, the BEA's second estimate of real GDP for the quarter indicates that its growth rate is likewise falling.
One thing to keep in mind when considering this information is that the U.S. Bureau of Economic Analysis can make significant revisions to its estimates of the nation's GDP during the first several years after it releases its initial estimates as it acquires more accurate and detailed information about the level of economic activity.
For example, the BEA's first estimate for GDP in the third quarter of 2012, released on 26 October 2012 just ahead of the last U.S. presidential elections, indicated that the real GDP growth rate for the quarter was +2.0%, up from the preceding quarter's real growth rate of +1.3%.
But now, according to Table 1 of the BEA's second estimate of GDP for the third quarter of 2015, which was released on 24 November 2015, we find that the real GDP growth rate of 2012-Q3 is now estimate to be just +0.5%, having fallen from the preceding quarter's real growth rate of +1.9%, as the economy of the U.S. was actually in the process of stalling out at that time. Only the U.S. Federal Reserve's expected intervention through its third Quantitative Easing program (QE 3.0), and its boosting effect on private debt, prevented the U.S. economy from fully sinking into recession at that time.
It will be interesting to see how the acceleration of private debt in the U.S. evolves should the Federal Reserve finally follow through on its plans to start hiking short term interest rates in the U.S. in the absence of any additional quantitative easing programs later this week.
Data Sources
U.S. Federal Reserve. Data Download Program. Z.1 Statistical Release (Total Liabilities for All Sectors, Rest of the World, State and Local Governments Excluding Employee Retirement Funds, Federal Government). 1951Q4 - 2015Q3. [Excel Spreadsheet]. Online Database. 10 December 2015. Accessed 14 December 2015.
U.S. Bureau of Economic Analysis. Table 1.1.1. Percent Change from Preceding Period in Real Gross Domestic Product.
1947Q1 through 2015Q3 (second estimate). Online Database]. Accessed 14 December 2015.
References
National Bureau of Economic Research. U.S. Business Cycle Expansions and Contractions. [PDF Document]. Accessed 14 December 2015.
da Costa, Polyana and Ponder, Crissinda. How Fed Moves Affect Mortgage Rates. (Timeline for Federal Reserve Quantitative Easing Programs QE 1.0 through 3.0). [Online Article]. 17 September 2015. Accessed 14 December 2015.
Previously on Political Calculations
Political Calculations. The Position, Velocity and Accelration of Private Debt in the U.S.. 5 November 2015.
Political Calculations. The Correlation Between Decelerating Debt and Falling GDP. 12 November 2015.
Political Calculations. QE and the Acceleration of Private Debt in the U.S.. 18 November 2015.
Earlier in 2015, we developed a new kind of chart to provide a more real-time indication of the relative health of the private sector of the U.S. economy, in which we tracked the cumulative number of dividend cuts being announced each day through each calendar quarter, which we've periodically updated throughout the year.
That exercise helps us get a sense of the extent to which economic distress may be building in the U.S. economy should the number of companies taking the painful action of cutting cash dividend payments to their shareholders rise above a given threshold.
Based on our observations of the available data going back to January 2004, if 10 or fewer firms announce dividend cuts in a given month-long period, the U.S. economy as a whole can be considered to be relatively healthy. But once the number of dividend cutting firms rises above that threshold, it indicates that recessionary conditions are present in the U.S. economy.
If that level rises above 20-25 firms in a month-long period of time however, that elevated number of companies cutting their cash dividend payments to shareholders suggests that some degree of contraction is occurring in the U.S. economy, where the impact will be felt by reduced economic activity, as the affected firms either delay or scale back their previous plans for growing their businesses.
Having covered the basics, let's look at where things stand as of the Friday, 11 December 2015. Our first chart compares the dividend cut trajectory of each quarter in 2015:
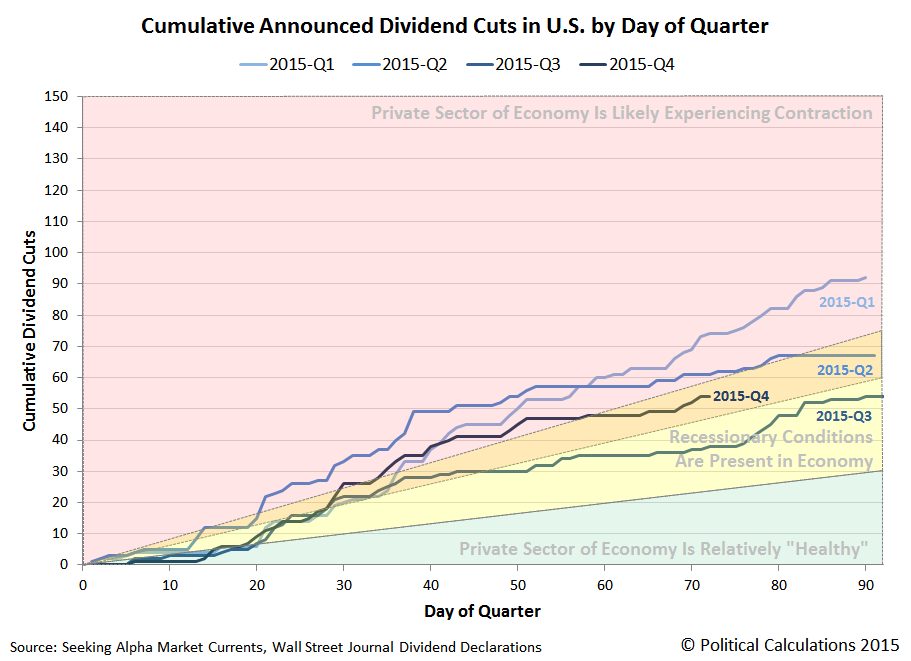
We observe that the dividend cutting trajectory for 2015-Q4 is currently falling within the orange-shaded region of the chart through Day 72 of the quarter, where after having spent much of the earlier part of the quarter in the red, contractionary zone, suggests that the pace of economic growth in the U.S. economy has improved somewhat since mid-November.
Overall, 2015-Q4 is turning out better than 2015-Q1, which saw near-zero economic growth, and also 2015-Q2, which was defined by contraction coming out of 2015-Q1, but improvement as the pace of economic growth improved throughout the rest of the quarter. That improvement continued through most of 2015-Q3.
However, the number of cumulative dividend cuts in 2015-Q4 to date is elevated above those recorded through the same day in 2015-Q3, which confirms that a downturn in economic growth has occurred, which appears to have begun in September 2015.
Our next chart will compare the cumulative dividend cuts in 2015-Q4 with those the fourth quarter of 2014.
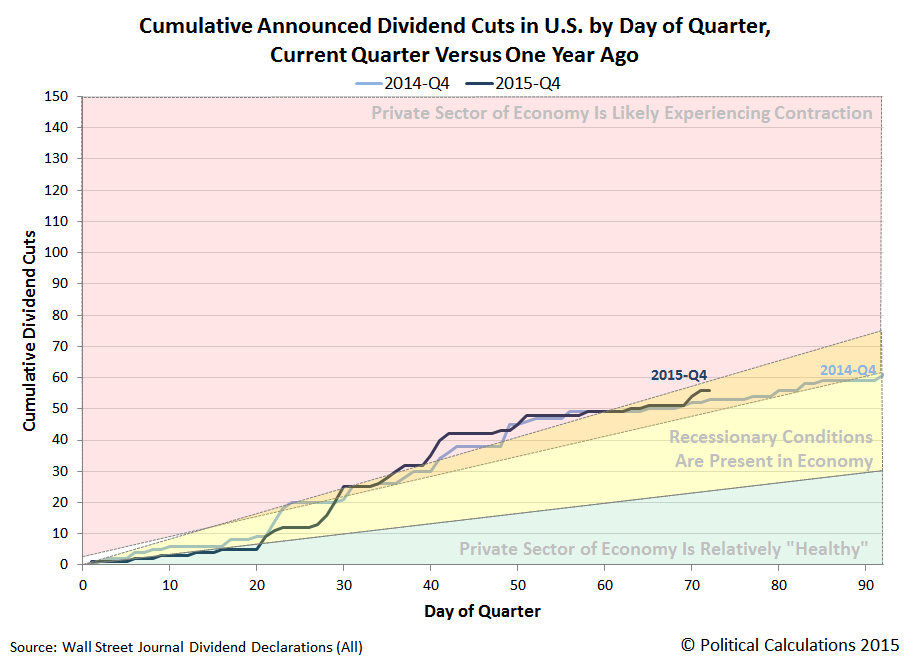
We see that by and large, 2015-Q4 has closely paced 2014-Q4, with history seeming to repeat itself through this point in 2015-Q4. At present, the trajectory of 2015-Q4 is slightly more negative than 2014-Q4, which is a development that has mainly taken place in the last week, which saw oil pipeline giant Kinder Morgan (NYSE: KMI) slash its dividend by 75% and the U.S.' largest copper miner Freeport McMoRan (NYSE: FCX) eliminate its dividend, while the U.S.' Number 2 and 3 oil companies Chevron (NYSE: CVX) and ConocoPhilips (NYSE: COP) kept their dividend payouts at their previously promised levels, but with the caveat that they would slash their previously planned capital expenditures by 25% each going forward, while Chevron will also lay off 10% of its employees, because that's what they believe it will take to avoid having to cut their dividends in the face of their forecasts for dwindling revenues.
We'll give the next-to-final word to Standard and Poor's Howard Silverblatt, whose comments comparing 2015 to 2014 overall through November in each year were reported in USA Today:
Dividend decreases are up 62% in 2015 from last year through the end of November, says Howard Silverblatt, senior index analyst at S&P Dow Jones Indices. Worse yet, outright omissions more than doubled to 100.
The first half of 2016 is shaping up to be a challenging period for investors, as dividend cuts through this point in 2015-Q4 are indicating that the U.S. economy is somewhere between slowing-to-slow growth and contraction.
Data Sources
Seeking Alpha Market Currents. Filtered for Dividends. [Online Database]. Accessed 13 December 2015.
Wall Street Journal. Dividend Declarations. [Online Database]. Accessed 13 December 2015.
Labels: dividends
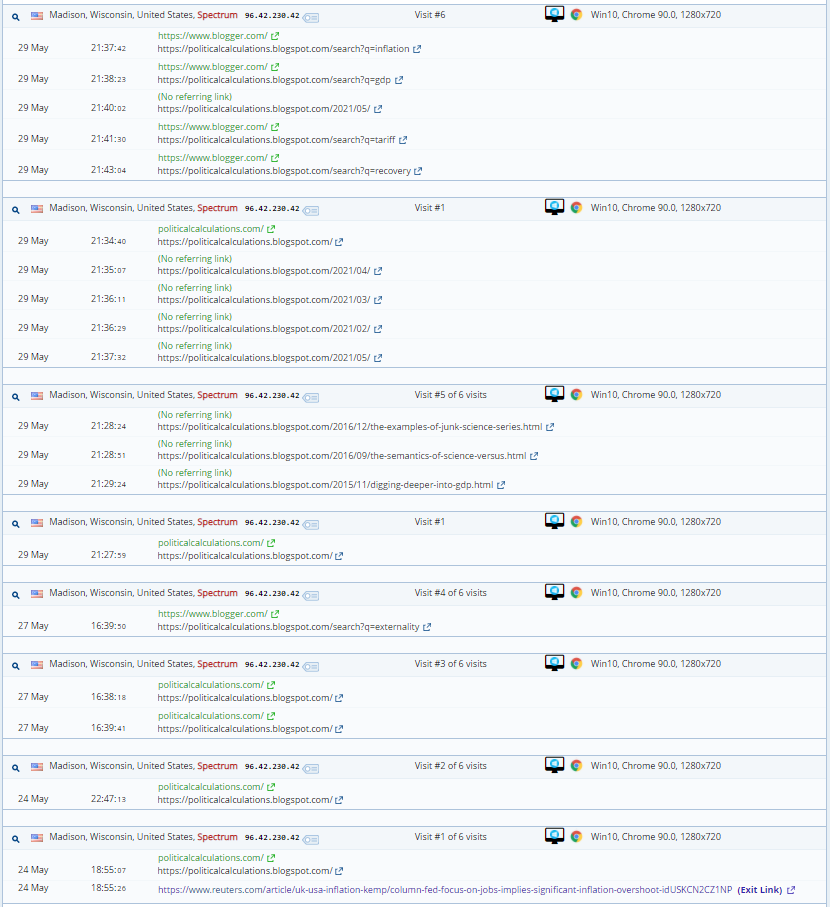
Update 28 December 2018: This post chronicles the creepy, stalking-like behavior of a very obsessed individual who became rather obsessed with us after we recognized that they were engaging is some pretty shady analysis and called them out for practicing pseudoscience. And in fact, prompted them to generate many additional examples. As you can see below, it took us a while to identify them (although they are not named in this post, which we've reserved for documenting their obsessive activity) and to really call out their ongoing bad behavior, where their stalking-like habits pre-date any of our work in exposing their misconduct. Speaking of which, shining a light on their misconduct certainly intensified their creepy behavior, which has continued for years.
It's time for a change of pace this week, and what better way to change the pace of things this week than to feature the death-metal band Macabre's cover of "The Cat Came Back"!
Why does the cat keep coming back? Perhaps the cat is the equivalent to a super creepy cyber stalker, which occurs to us because of some really unusual and ongoing site traffic we've noted.

21 visits, and it seems that they still haven't found what they're looking for.
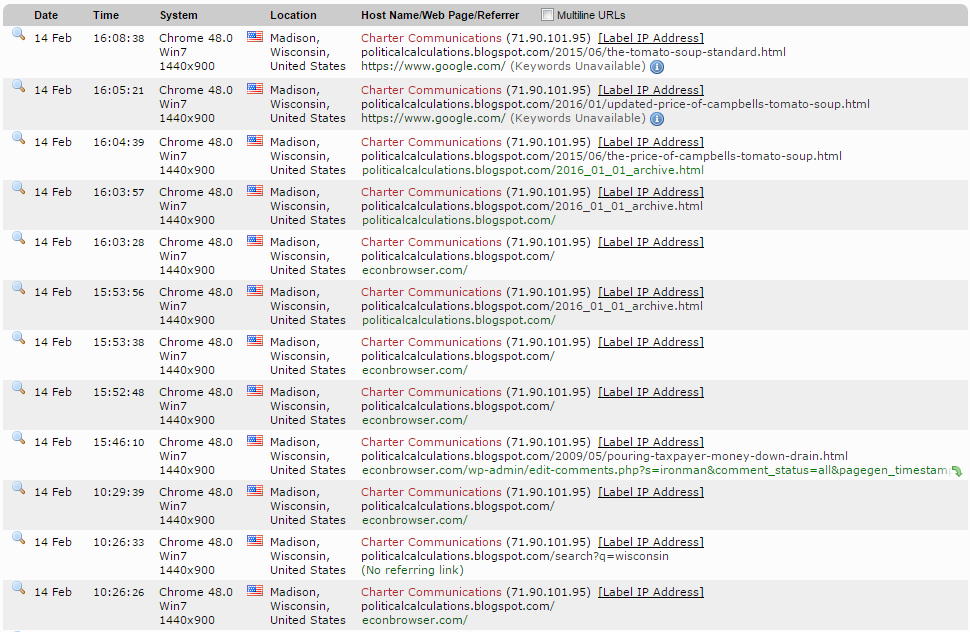
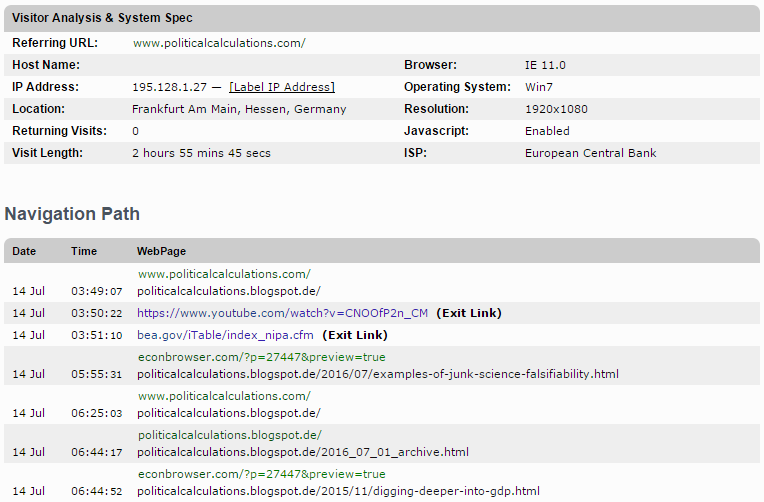
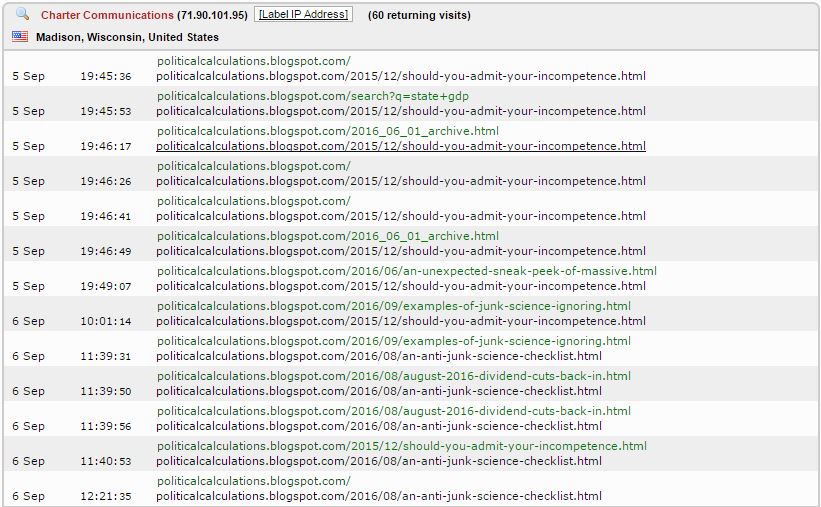
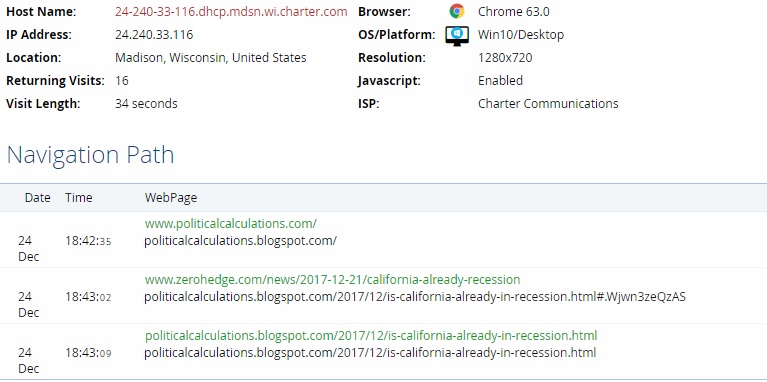
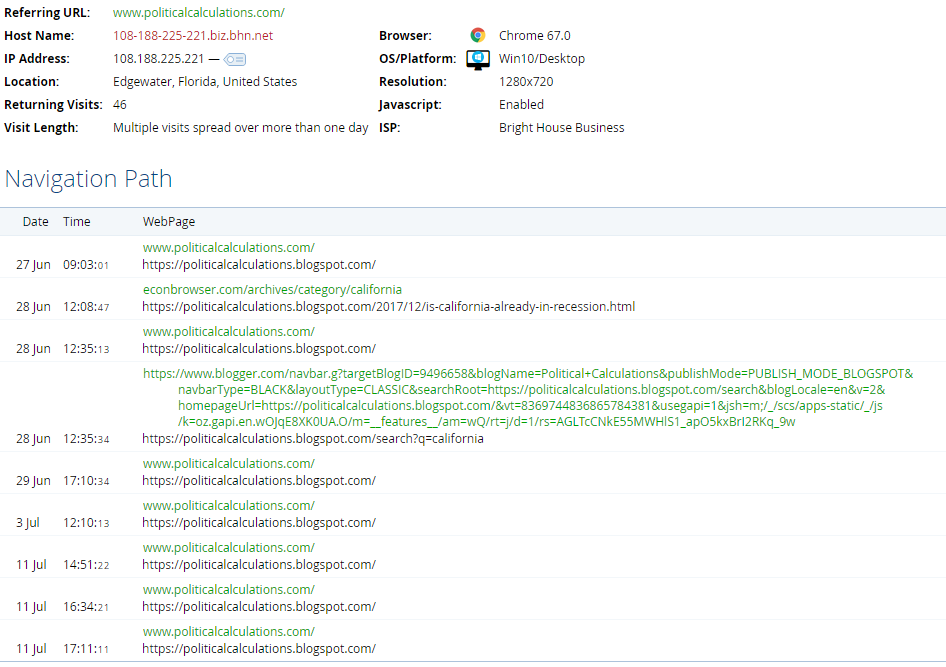
What are they really looking for? Here's a clue from our log of their earliest visits (note the host name and IP address in the image below, since their visits are mixed with others from the same city):

Our working theory is that a combination of guilt and paranoia is driving the unusual activity, which frequently features searches of our site for "chìnn" and "alec". We're considering inventing a guest contributor by the name of, you guessed it, "Alec Chìnn" just so they can actually find the imaginary pot of gold at the end of their own personal rainbow.
Update 19 January 2016: The cat came back again!...

And here we had thought he was a goner!
Update 17 February 2016: But the cat came back!...
He just couldn't stay away. And what a way to spend so much of Valentine's Day!
Update 20 March 2016: Once again, the cat comes back, but since Valentine's Day, the cat keeps coming back more frequently....

Does "super creepy cyber stalker" really cover the bizarreness of it all?
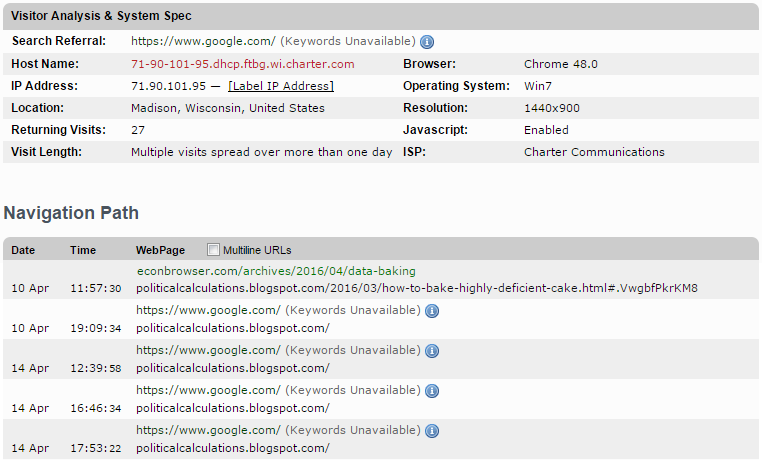
Update 31 March 2016: The cat is a nocturnal creature. The timestamps listed below are Pacific Daylight Time, which is two hours behind the cat's home residence of Madison, Wisconsin.

Judging by what they've read, they completely missed the cake we left out for them, since Blogger's calendar archive only captures the latter portion of the month. Which is a shame because they've given themselves away - we now know who they are. We'll have to serve them some after the next time they visit....
Update: 7 April 2016: We didn't have long to wait.

So we served them some over at their place.

And yes. Everybody knows.
Update 8 April 2016: Another late night! Where does the time go?

Update 9 April 2016: Oh, this is classic - the cat went around the clock! We'll apologize in advance for duplicating some of our site traffic log, but to really appreciate the sheer time investment involved, we really do need to show the last two days!...

They must not have liked the cake. They seem... quite agitated.
Update 16 April 2016: Not to mention both obsessive and paranoid.
Although it looks like it, there may not really be such a gap in between the cat's visits. On the days in between 10 April 2016 and 14 April 2016, we noticed a number of visits from a new visitor originating from the same city, which we suspect is the cat "monitoring" our site using their employer's resources, which we base upon a common pattern that we've seen in their site visit activities as documented above. Unfortunately, that's not yet enough for us to confirm that it is the cat. If so, unless they get much smarter in a hurry, which is pretty unlikely based on all that we've seen to date, we have no doubts that their paranoid obsessions will give themselves away once again.
So we're not going to share those particular site traffic excerpts until we have confirmed their identity. In the meantime, we'll be playing the role of Eisenhower to their Eugene McCarthy, which is perhaps the best analogy for describing the behavior of the cat.
Update 8 June 2016: Today's update from our historic site traffic below overlaps some of the traffic we've previously shared for April 2016, but fills in a portion of the cat's visits that we had previously omitted.

The cat seems quite obsessive, even though we've made a point of not provoking them for over two months. Alas, we may have just posted something that could send them over the edge, given how sensitive they are to even mild criticism. Then again, they now have bigger problems than just being super creepy.
Update 16 June 2016:
Let's pick up the action from 6 June 2016, slightly overlapping what we last covered to make sure we haven't missed anything!

We can confirm that we succeeded in setting the cat off on a new frenzy of activity. In case you're wondering, the post that we designed to send them into conniptions is the one they saw first when they visited our site on 8 June 2016 at 6:18 PM Central Daylight Time (their time, or as our traffic log shows, on 8 June 2016 at 16:18 PM PDT), which they specifically visited again on 16 June 2016 at 12:43 AM Central Daylight Time (or 15 June 2016 at 22:43 PM PDT, as shown in our traffic log above).
Could the cat be having trouble sleeping? You be the judge if we're responsible for affecting their emotional state.
By posting what we did, we made them desperate, once again, to cover up their deep shortcomings as an economic analyst. By posting when we did, we made them stew for nearly an entire week until certain new economic data, including significant revisions, was posted on 14 June 2016 at 7:30 AM Central Daylight Time (8:30 AM EDT).
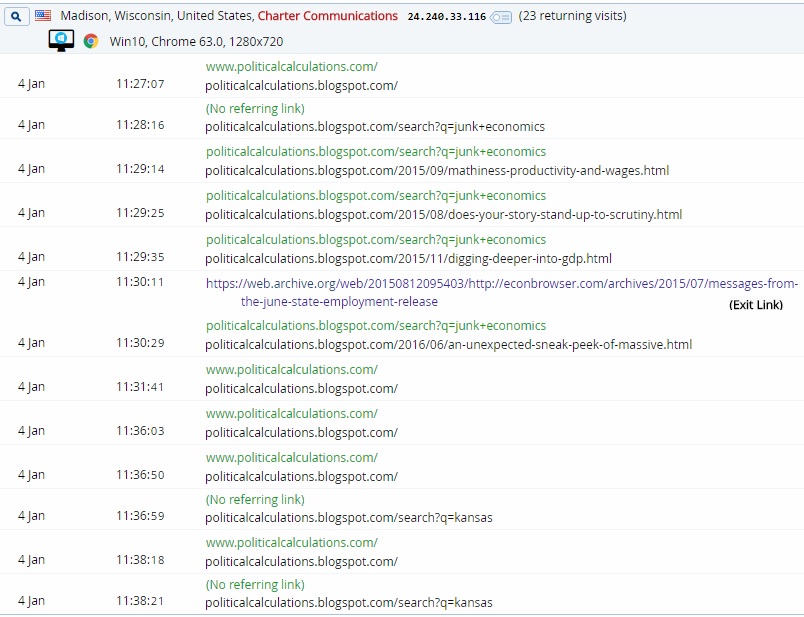
The frenzy of activity was then unleashed on 14 June 2016, when beginning as early as 8:30 AM Central Daylight Time, the cat was compelled to spend the next 7-8 hours of their life feverishly trying to make the crackpot argument that every economic disappointment in the state of Kansas since January 2011 was the fault of tax cut policies implemented by its governor. Never mind the impact that the state's severe drought had on its large agriculture industry, the microrecession that impacted in the state's general aviation industry when President Obama's promised national economic recovery failed to materialize, or a massive cut in defense spending that occurred in the state that was later amplified by the defense spending cuts proposed by President Obama through the budget sequester, just to name a few.
That doesn't mean that Kansas' governor is off the hook. The combination of tax cuts and failure to restrain the growth of state government spending in the state more in the face of the deep non-policy related economic blows it was taking created a fiscal problem for the state's government, which wasn't helped by the federal government cutting $794 million worth of its annual spending in the state during the period spanning 2011 through 2014. By contrast, state and local government spending in Kansas was largely flat from 2010 through 2014.
We're going to go out on a limb now and make a prediction - the cat is going to spend a great deal of time, once again, putting together a new attack attempting to refute the reality that the severest portion of the multi-year drought that Kansas experienced in the years from 2011 through mid-2014 had a disproportionate impact on the state's economic output. They'll be using the BEA's newly revised data for the state when they do to make their case, and will pretend that their previous attempt never happened.
Sadly for them, we've already updated our analysis and can demonstrate otherwise, and what's more, we can now confirm that the drought has had a lingering effect on the state's agricultural output even beyond the end of the drought, particularly because of how it impacted the state's livestock industry, which the BEA's newly revised data helps clarify.
That is the other reason why we were so keen on the timing for our post - we wanted to be sure we used the same data that they did in that earlier failed analysis, where the cat pretty much threw a whole lot of junk science from their cookbook against us. Which we'll be periodically revisiting at our leisurely convenience, so they can finally realize the true purpose of their life of serving as a cautionary warning to others....
Unlike the cat, we're happy to be wrong - we don't have our ego so tied up in the analysis we do that we cannot emotionally bear being legitimately corrected. We're not going out of our way to bake data or to cook our analysis to ensure that we arrive at predetermined results - what we do involves real analysis and the application of sound scientific principles, so if we ever are wrong, we don't need to take anything personally - we can simply focus on getting better at what we do. The cat should really learn from our example.
Now, if the cat would just stop being so super creepy!....
Update 16 July 2016: The cat just can't stop being so super creepy!

We haven't seen any traffic from the cat's Madison, Wisconsin IP address since 28 June 2016, but we strongly suspect they are traveling abroad. To find out for sure, we poked the cat and got yet another frenzied response that culminated in what we would characterize from our layman's perspective as a particularly profound case of psychological projection. Better still, it would seem our prediction from 16 June 2016 has come true....
Here's a sampling of the traffic that we're now seeing from abroad. Note the level of obsession in the following screen shot of our site traffic, which is what first alerted us to the cat's travels, where they are continually monitoring one particular post that would be of very little interest to anyone in the nation they're accessing our site from.

They appear to be traveling about, which is likely why we're seeing their activity being processed through different ISPs.

Filling in some of the days in between - note the continuing obsession:

They also appear to be using the resources of the European Central Bank to facilitate their stalking-like activities. There are some really misguided priorities going on here!
Do you think they realize that the fact that we appear to have the ability to drive their frenzies to this extent means that we've rather completely pwned them? What's even more fun is that they've doubled down on their particular brand of junk science, so they've given us even more material to work with!
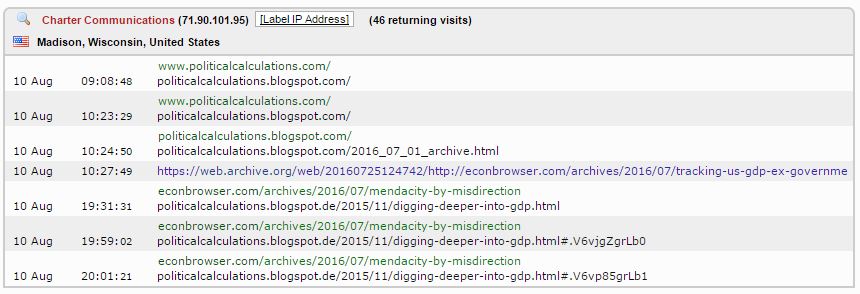
Update 9 August 2016: We did some additional digging in our site traffic logs to fill in some of the gaps in what we've previously captured. We apologize (again) for any duplication from visits we previously documented.
But hey, at least the first 31 site visits made by the cat to our site between 23 July 2016 and 6 August 2016 are brand new!

As are the 13 visits over 3 hours on 2 August 2016, which brings their total number of visits to our site just for that day up to 20....

Finally, let's close out their trip to Germany by reviewing all the times they used the resources of the European Central Bank to conduct their stalking-like activities. The first three visits are ones we previously documented.

In case you're counting, they stalked our site 15 times on 3 August 2016. So, on just a two day long period, they visited our site 35 times, spanning nearly 10 hours periods on both days. Outside of updates, which we don't do often, we typically post once each day that the U.S. stock market is open. That is one very, very obsessed cat!
Alas, their trip to Germany appears to have come to an end. They have once again returned to their home in Madison, Wisconsin.

This time, our only prediction is that their creepy stalker-like behavior will not end.
But then, if it weren't for their super creepy stalker-like behavior, we wouldn't have considered it worthwhile to take them on!
Update 10 August 2016:
Sigh. This time, they made 6 visits to just 2 pages over nearly 11 hours.
The sad part? It was all just to produce this half-assed "analysis". The even more sad part, if you scroll up, you can see that they are very clearly ignoring a post that they specifically clicked to review very late at night on 15 June 2016 that rather definitively contradicts their claims, which means that they've just managed to tick another category off on the junk science checklist.
The really amazing part? Check out all the time they spent visiting our site over the last month just to produce that effort! How many page visits over how many hours over how many days? And that's the best analysis a Harvard-educated PhD economist can produce after such a time commitment? Wow!
Update 12 August 2016:
We're trying something new. Taking advantage of the comments at Env-Econ, which linked to that crap analysis we previously mentioned, we realized it would be catnip to the cat. So we dropped a couple of comments at the post (sorry John!), where we hope to achieve some much needed behavioral modification on the part of the cat.
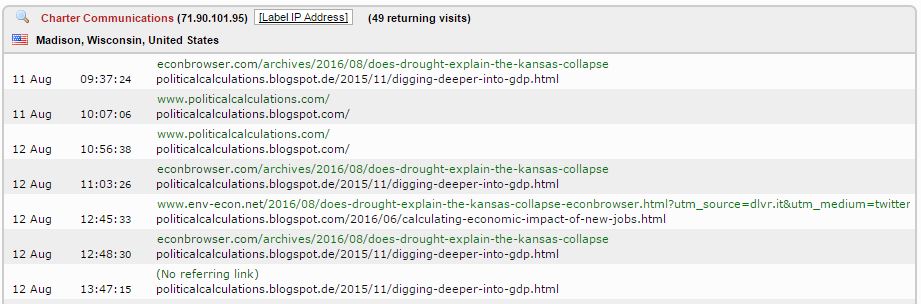
Will calling out their persistent stalking-like activities curtail their bad behavior? We'll find out....
Update 1 September 2016:
The end of August 2016 has arrived, and we have to say the success of our behavioral modification experiment would appear to be mixed.
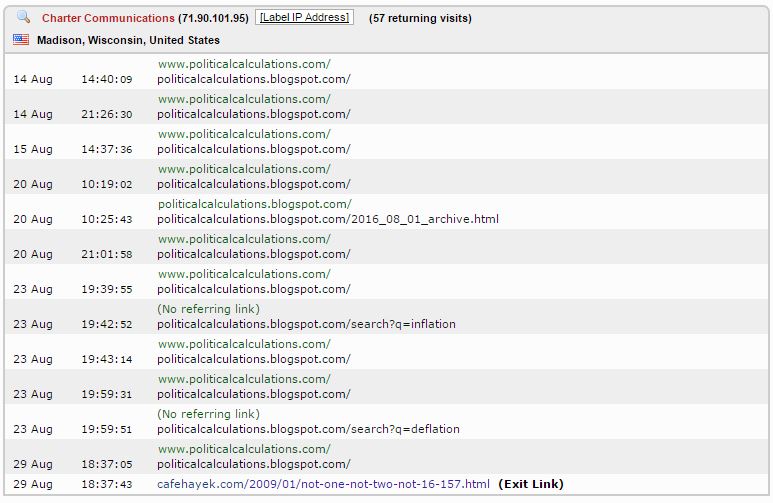
Compared to what the cat's previous manic activity level, we've clearly achieved a reduction in their more-than-one-year-long-ongoing-creepy behavior. But then, 23 August 2016 rolled around and we find that they're still quite obsessed.
Flash forward to 29 August 2016, and we find that they're quite interested in our fourth example of junk science, where so far, 75% of the content hasn't involved their own pseudoscientific practices in any way. Shame they didn't learn sooner, because that particular lesson is one they'll soon find quite relevant.
Update 7 September 2016: With the cat having resumed their stalking activities again, we've opted to attempt another intervention for them to address their creepy behavior. We've given them some required reading assignments, through the magic of URL redirects.
There is a link in the second assignment to some additional material that they need to read before we will consider allowing them to progress further in their required reading assignments.
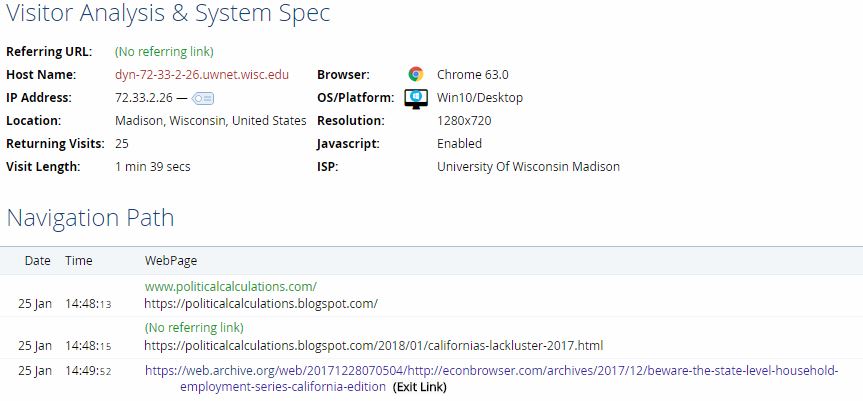
Update 28 October 2016: Well, they never completed their required reading assignment. Instead, they've made changes to how they access our site. In the excerpt of our site traffic below, we've captured them using the resources of a university to engage in their stalking-like behavior, in addition to a new home setup.
We're going to let them think that they're getting away with it for now. As it stands, we can claim some success in that we've succeeded in both reducing the volume of their stalking-like activities and in making some of their behavior visible to their employer.
Update 23 December 2016: They just can't stay away!

It's really creepy just how obsessed the cat remains with us!
Update 31 December 2016: They just had to visit one more time - perhaps because they've included us in their annual enemies list. (It's pretty bizarre that the cat actually thinks that's a good idea, given the kind of personality traits that go along with the kind of people who have had or who may have enemies lists. Even if one has those kinds of personal shortcomings, it's just not well considered to advertise them by publishing evidence that you share those characteristics.)

Update 22 January 2017: It's a new year, they have a new IP address that we missed in the previous update. And so, the cyberstalking-like activity continues in 2017, with the cat wearing a new mask....

We've been watching Leah Remini's show discussing some of the seamier side of her former church, and we just can't help but see the parallels between the kind of intimidation tactics alleged to be employed by the church under the mantra of "fair game" and the stalking-like behavior of the cat. We have to say that we're really sympathetic to the situations of our fellow journalists, where the main difference between their situation and ours is that while that church employs private detectives to function in that role, the super creepy cat does it themselves. Just scroll up for the proof.
Update 11 April 2017: Guess who's back? Back again?
Yes, the cat's came back! Not as often as before, but they still can't quit their obsessive behavior! The latest site traffic log overlaps some of the previous update from their new IP address.

And it appears that they're making limited use of their employers' resources again.

Update 4 August 2017: Look who's baaack!

Update 22 October 2017: New format for our site traffic reporting, but same old stalking, covering a period from 9 August 2017 through 19 September 2017.
Update 26 October 2017: Was somebody's ears burning?

Update 26 December 2017: We've been sitting on this following site visit for some time - the snapshot below is from a different filtered view of our site traffic, which overlaps their previous visit at the end of October 2017.
Interesting side note - we've discovered that we're not the only site that receives such narcissistic and obsessive attention from this particular visitor.
Speaking of which, for the real reason we've updated this post today, check out how they spent their Christmas Eve!...
Obsession makes one sad and lonely....
But wait, there's more! While we've been doing some cleanup work behind the scenes during our annual week-long holiday, the cat came back again!

The cat's ongoing obsession with us just never stops. We wonder if it would continue if they knew just how close to Harvey Weinstein-level creepy their behavior is.
Update 27 December 2017: Wow! Look who's obsessing again!

Update 30 December 2017: The cat keeps coming back.

Took a day off, but just couldn't stay away.

It looks like the cat has dedicated quite a lot of hours over multiple days just to weakly criticize our analysis of California's employment situation and the data that the state's Employment Development Department generates to track it in near-real time. Sadly, they failed to provide any worthwhile insights into any better approaches that don't involve waiting months or years for revisions that, for state politicians who might like to respond quickly to early evidence of potentially deteriorating conditions before they might become entrenched, would be an incredibly useless and counterproductive exercise. At least we can now also confirm that they do not comprehend Pareto's 80-20 principle either in why serious analysts or observers would choose to pay closer attention to the conditions of the largest state economies within the nation over that of a single, smaller state where the narcissistic cat is employed at a local university.
Update 4 January 2018: Guess who's already failed their New Year's resolution to give up their stalking-like behavior?

Worse, they seem intent on launching into a new frenzy of obsessive activity.
What inspired this latest round of frenzied obsession? Your guess is as good as ours - the best we can come up with is that they were highly angered by our last post of 2017, in which we simply linked to our Examples of Junk Science series since we brought up the topic of falsifiability in science as it related to what we called the biggest math story of the year, where our series coincidentally features multiple examples of the cat's analytical deficiencies.
Other than that, they seem to be really getting themselves really worked up in yet another masturbatory exercise aimed at diminishing their critics through the posting of their annual enemies list. Which this year, appears to also include taking on relatively anonymous people who simply posted mildly critical comments on their blog, even though we would guess that over 95%, if not 99%, of their site's regular readers would never know those comments existed. Gotta puff themselves up to feel big!
Update 14 January 2018: Back again after a fortnight away.

Update 25 January 2018: It looks like we've found the cat using their employer's resources again to conduct their unending stalking-like activities.
In case you're wondering, yes, their ears were burning again. Must suck to be so narcissistic that they cannot bear the concept of anyone even being mildly critical of their kind of "analysis"/"ongoing smear campaign".
Five hours later, they checked in, again, from home....

In between, we made some minor changes to the post that got their ears burning, where we also added a bit of extra information to the bottom. Let's see if they address any of the shortcomings that they've so far declined to even acknowledge.
Then again, that refusal to acknowledge their misconduct also means that they have never disputed that it occurred - we view their whole campaign as a poorly-considered attempt to distract attention away from their bad behavior.
What we did is actually a bit of an experiment - if the cat links to our post in their next smear attempt, they know in advance that extra information calling attention to their misconduct is there, where everyone they might get to click through to our site will see it. Will that deter them? Or might they take the opportunity to finally come clean and acknowledge their misconduct? Or their very creepy and obsessive behavior? It's all a question of their personal compulsion, isn't it?
Update 28 January 2018: Let's see, the cat has been engaged in their stalking-like behavior for at least 132 weeks (actually longer, but we only began documenting their narcissistic, obsessive behavior in July 2015 - just scroll up to confirm our description for yourself).

So yes, the cat's bizarro crap has been going on for over two and a half years. Know what's really scary? We're not the only site that receives this kind of attention from the cat - there are others who might not know of the cat's strange devotions.
Update 12 February 2018: Here they are accessing our site using their employer's resources again:

Well, this last one is interesting. The cat is specifically focusing on a post that really digs into the shared personality traits of pseudoscientists and sexual harassers - particularly the ones that abuse their positions of authority to go after whistleblowers who challenge their misconduct - which is surprisingly timely given the recent zeitgeist involving Hollywood's latest sex harassment scandals, and as an added bonus, addresses how President Eisenhower defeated a powerful rival with similar personality traits (Senator Joe McCarthy) on the anniversary of the latter's launching of his signature smear campaign.
Do you think the cat realizes that the article *isn't* written about him? Or is the cat so narcissistic that they actually think it is?
Update 13 February 2018: We appear to have struck a nerve....

No matter how you slice it, creepy.
Update 15 May 2018: Imagine, if you will, being stalked by a narcissistic individual who dresses like a creepy clown and who repeatedly runs up to the windows of your house, looks in, makes noise, then scampers off to proclaim their "greatness". Then, one day, after they realize that we've called them out for their bizarre behavior, they do it again, behaving exactly the same way they repeatedly have before, only this time, they've dressed up like a creepy French mime. The cat is now using a Proxy VPN to attempt to disguise themselves.

Do you think they realize that their creepy behavior is what is giving them away?
But wait, it gets better! We ran a proxy detection test for the IP address associated with the VPN proxy that they're now using. Check out how it's associated:
This IP address (107.77.207.215) is a proxy connection and is NOT associated with any SPAM/mail blacklists. IPQ's fraud score algorithm has rated this IP address as high risk, scoring 95 out of 100. We are weary of users or transactions originating from this IP address. This decision is based on high confidence due to recent abuse from this connection.
Abuse. Fraud. Sounds about right for the cat.
Update 16 May 2018: The cat is going on quite the frenzy.
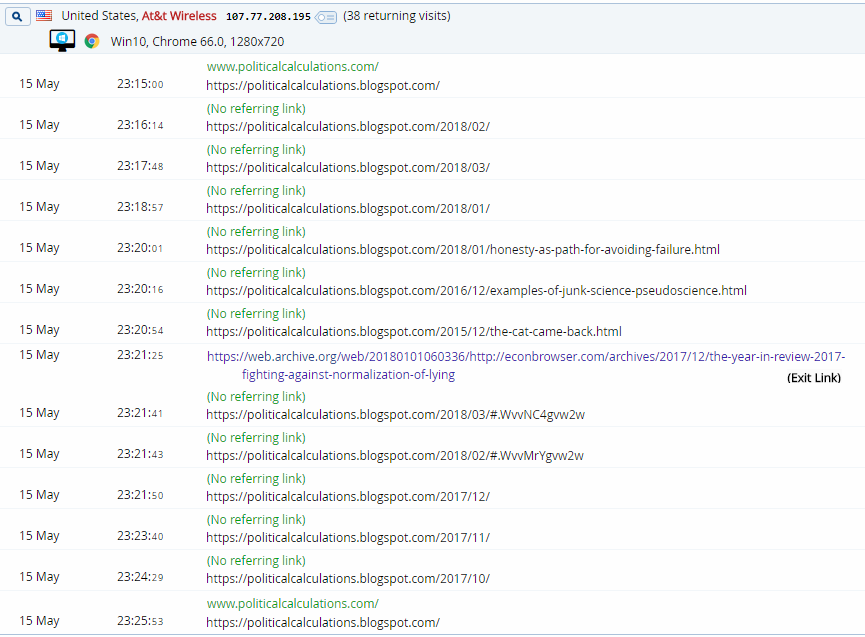
Note that the cat is aware that we're exposing their creepy, stalking-like behavior. And yet, the cat is either unable or unwilling to change it. Perhaps we were "closer to the truth" than we previously realized....
Update 28 May 2018: A creeper's gotta be creepy:

Update 28 June 2018: And the creepy stalking continues. Fun side note, the creepy cat might have finally caught on that they had an ethics problem, where they've been falsely representing our views regarding recessionary conditions in California.
Here's the backstory. On 26 December 2017, after an article we had originally about the state of California's economy written on 14 December 2017 had been picked up by ZeroHedge, we modified the text of the original because our outlook for the state of California' wasn't as gloomy as we initially had presented it, where we changed the words "recession has" to "recessionary conditions have" in one paragraph. We made that change at 11:41 AM Pacific Standard Time.
The cat, still angry and bitter at our having previously prominently featured their ethical pratfalls in our Examples of Junk Science series, decided to mount a new series of smears attacking us on their blog. If you scroll up the update for 26 December 2017, you'll see that they happened to visit our site just before, and really, just as we were editing the original article.
They would go on to publish their first attack referencing our article on the next day, 27 December 2017, after 6:00 PM Pacific Time. Now, that's significant because they visited our site twice on 27 December 2017, at 1:41 PM and later at 4:35 PM Pacific Time, so they clearly saw the modifications we had made before they launched their smear/straw man attack. What's more, we went the extra mile to emphasize the changes in boldface font, so they couldn't be missed. We haven't modified the article since we re-posted it on 26 December 2017 at 11:41 AM PST.
So they knew, before they even posted their first attack on our analysis in the evening of 27 December 2017, that they were purposefully misrepresenting our views about whether California was in recession or not. And they've now done so for the seventh time. Talk about obsession! And dare we mention that because they're attacking a false representation of our views, all that creepy cat is doing is beating up on a phony straw man.
What can we say? The narcissistic cat's gotta puff themselves up to feel big!
They're also stooping to quote us out of context. If you follow the link, you'll see that they are now claiming to have accessed the text they quoted from our site on 27 December 2017 as representing some sort of recession call on our part, which we had clearly modified more than a day beforehand to its present form, when we dialed back from stating that "recession has" arrived in California to "recessionary conditions have" arrived. We can attest that the article has not been changed since we reposted it on 26 December 2017 at 11:41 AM Pacific time. Nor has there ever been any need for us to do so, since the modified analysis, which we've supported with subsequent analysis, has held up over time.
Let's be clear about how we're using these words. Using "recession has" would imply that the state economy is experiencing negative or stagnant economic growth. "Recessionary conditions have", by contrast, would imply that sectors within the state economy are experiencing negative or stagnant economic growth that doesn't necessarily extend to the whole state economy. The latter phrasing better agreed with how we were actually reading the data, where the text that the dishonest cat is excerpting is simply referencing the available data that could support either scenario in our original analysis. But since the cat has failed to recognize the modification in our interpretation of the state of California's economy, we can only conclude that they have purposefully chosen to misrepresent it as a "recession call", even though it could not be legitimately considered anything of the sort after 26 December 2017 - longer than they've been attacking our analysis on their site.
These kinds of ethical shortcomings permeate much of the content the cat generates on its site, where if you want to find out more, be sure to check out our Examples of Junk Science series. Which since they're now seven posts into their false narrative, they've violated both the "Progress" and "Goals" categories in our "How to Detect Junk Science" checklist. If they're reading this (and we know they do), here's a thought - purposefully "misrepresenting an opponent’s views... means you’ve lost the debate". Continuing arguing against a phony straw man isn't a behavior that many people would describe as rational.
Let's update the latest examples of their creepy obsession with us:

It looks like they're still using a VPN proxy to try to hide their stalking-like behavior. They don't seem to realize that its their obsessive and narcissistic behavior that keeps giving them away....
Update 29 June 2018: We're surprised that they're still doing that stalking thing, especially with this incident just in the news - the level of narcissistic, obsessive behavior is certainly similar, and we can completely sympathize with the woman who was being stalked by the individual.

Like the offender in this incident, the cat doesn't seem to be able to either constrain or correct their stalking-like behavior.
Update 22 July 2018: And the creepy cat is back! First, let's catch up on where their stalking-like activity since our last update (the first five entries duplicate site visits that we've previously tracked):
And let's catch up to today....

"Coincident"? Or just more creepy stalking-like conduct? (Yes, that was an intentional pun!)
Update 24 July 2018: They're definitely on a new frenzy. Also seem to be doubling down on their peculiar brand of pseudo-science at their site in the last several days.

And they're now up to 8 straw man attacks on an article that has never said what they've claimed for longer than they've been attacking it. In fact, to repeat an earlier entry, we can demonstrate that they've known otherwise since they accessed our article twice on 27 December 2017, more than 24 hours after we had modified it to better reflect our thinking on the likelihood of California being in recession, where we settled on the data being more consistent with "recessionary conditions" being present within California's economy:
We guess they're going to have to go for "out of context" to try prop up their straw man. To quote cartoonist Scott Adams again, "misrepresenting an opponent’s views... means you’ve lost the debate". But, a creepy cat has gotta puff themselves up to feel big!
Update 24 December 2018: We've taken a few months off from reporting the creepy cat's stalking-like behavior, but since they seem to now be on a new frenzy, it's time to fill in a portion of the gap. Here is a frenzy they went on from 21 September 2018 through 25 September 2018:
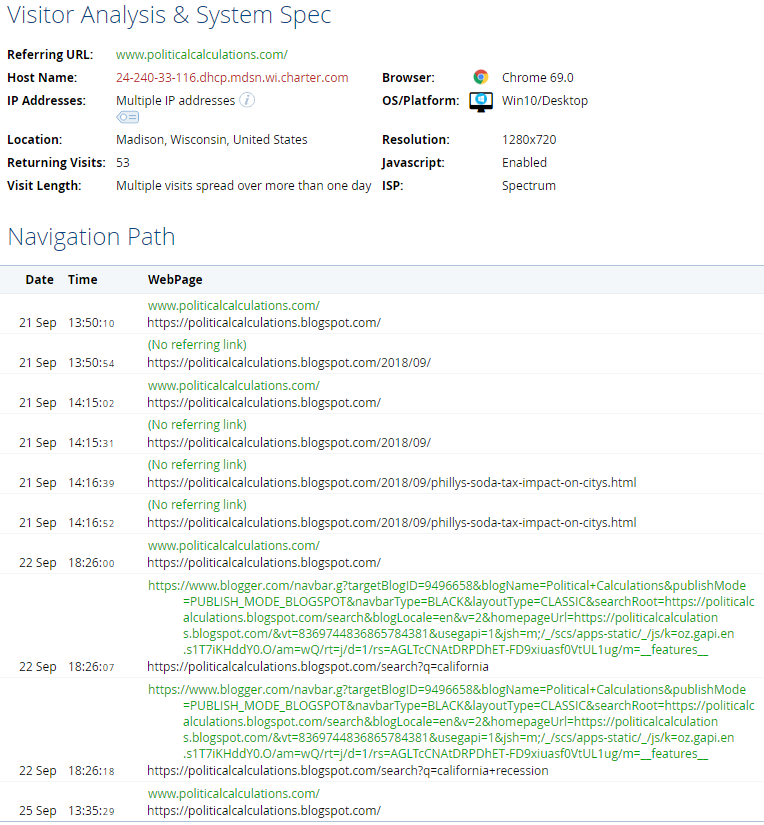
In the middle of that, they continued their frenzy of accessing our site using their employer's resources on 24 September 2018:

We wonder if the cat has ever abused their position to direct other members of their employer's workforce to participate in their obsessive stalking-like behavior.
Here they are again in early December 2018:

And finally, here is their new late night frenzy (just for the record, the timestamps are shown in Pacific Time, where times after 22:00 (10:00 PM) correlate to times after 0:00 (12:00 AM) in the cat's Central Time zone.

They are likely gearing up for the annual presentation their perceived enemies list. Funny - we haven't mentioned them at all outside of updates to this post and one other in the past year - the cat's bizarrely obsessive behaviors continue, where it seems they've got to puff themselves up to feel big!
Update 28 December 2018: Want to see how the cat is spending more of their 2018 Christmas holiday?

Oh, and they are now up to 12 episodes in their latest smear campaign/straw man attack. Do they realize that they're providing detailed documentary evidence of their crazed obsession with us?
Update 19 January 2019: But why stop all the obsessive stalking-like behavior in 2019?

Make that 13 episodes for their smear campaign/straw man attack series, which only seems to appeal to the syncophants in their echo chamber. The poor cat must be feeling pretty low to continually have to puff themselves up to feel big in their own mind.
Update 8 March 2019: It's really surprising how little time we spend paying attention to the cat's ongoing creepy behavior, which we're now updating through 7 March 2019. By comparison, the cat spends far more of their time engaged in their stalking-like activity in their obsession with us, which also appears to involve using their employer's resources.

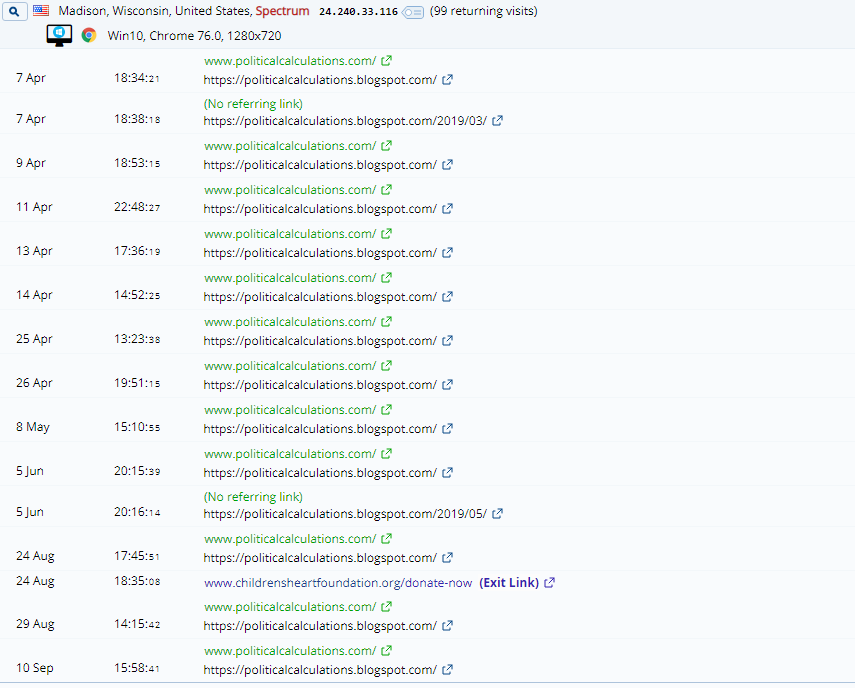
Update 10 September 2019:
The creepiness never stops! First up, here is the creepy cat's periodic stalkings from a very familiar IP address:
And from three others:
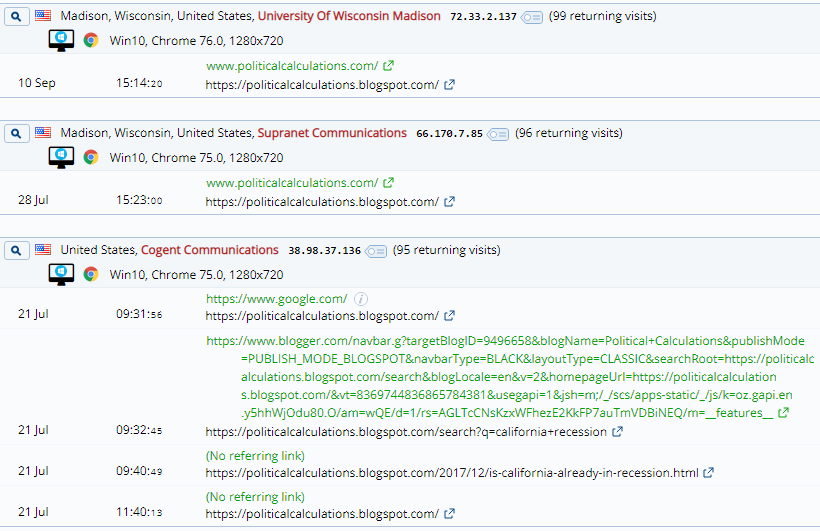
If it seems like the cat has diminished its stalking-like behavior, that may be because they appear to have become quite obsessed with disproving speculative comments left on their blog about future soybean prices. Talk about bizarre obsessions!
Speaking of which, guess what? The cat came back, again!...

Update 26 December 2019: Guess how this creepy cat is spending yet another Christmas! And lots of their abundant free moments, often while using their employer's resources, as long as we're catching up since mid-September 2019....

Update 20 January 2020: The stalking never ends! Looks like the super creepy cat may be working themselves up into yet another frenzy to attack their straw man target!

A creepy cat has got to puff itself up to feel big!
Update 31 March 2020: This is the last entry we've seen for the creepy cat, coming right as the coronavirus pandemic reached the U.S. and triggered lockdowns, including the disruption of classes at universities. We suspect that disruption has a lot to do with the cat's "break" from its regular stalking.

We don't know how long the cat's break from stalking-like behavior might last. At some point, we think the very angry and obsessive cat who both learns and forgets nothing won't be able to resist the urge to return, if only because they need to feed the urge for yet another impotent straw man smear attack!
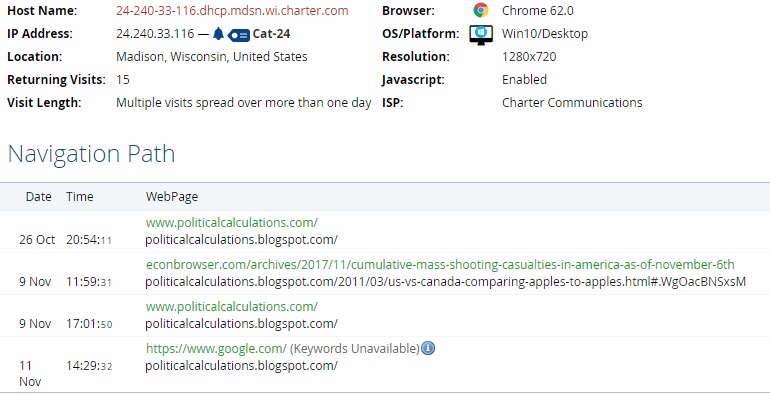
Update 2 June 2021: The cat came back! The following excerpt from our site traffic logs shows their signature behaviors giving themselves away yet again:
How long before the straw man attacks resume?
Labels: none really
Welcome to the blogosphere's toolchest! Here, unlike other blogs dedicated to analyzing current events, we create easy-to-use, simple tools to do the math related to them so you can get in on the action too! If you would like to learn more about these tools, or if you would like to contribute ideas to develop for this blog, please e-mail us at:
ironman at politicalcalculations
Thanks in advance!
Closing values for previous trading day.
This site is primarily powered by:
CSS Validation

RSS Site Feed
JavaScript
The tools on this site are built using JavaScript. If you would like to learn more, one of the best free resources on the web is available at W3Schools.com.
Other Cool Resources
Blog Roll


