Perhaps the only thing cooler that the JPL's image of the dwarf planet Ceres taken by the Dawn probe....

Would be if the folks at JPL had to finish Obi Wan Kenobi's "That's no moon..." quote.
It certainly beats seeing faces on Mars!
Labels: technology

As econoblog readers, we follow Econbrowser pretty regularly, mainly for Jim Hamilton's insights, but recently, we've begun paying closer attention to the comments of his co-blogger, Menzie Chinn, who is an economics professor at the University of Wisconsin-Madison.
That's primarily because of the recent rise to prominence of Wisconsin state governor Scott Walker in 2016 presidential polling, whose performance in office Chinn has often criticized. Normally, we're entertained by Chinn's analysis, since it frequently involves comparisons of the job growth between Wisconsin and its western neighbor Minnesota since Walker was sworn into office in January 2011, which we find funny because of all the states surrounding Wisconsin, the composition of Wisconsin's economy is much less similar to Minnesota than it is to any of the states with which the state shares waterfront footage on Lake Michigan, which is something that one might think an economics professor at the University of Wisconsin-Madison would know.
Recently, Chinn has commented on two issues facing Wisconsin that are connected to each other: the state's reduction in tax collections following the implementation of Governor Walker's tax cuts in 2014 and also the Governor's proposed cuts in state funding supporting the University of Wisconsin, which follows from the state's reduced tax revenues.
Let's look first at Wisconsin's tax collections. Our first chart shows the rolling four quarter total we calculated for the state's tax collections as reported by the U.S. Census Bureau from 1995 through the end of the third quarter of 2014, which at this writing, is the most recent data available. We've annoted the chart to indicate periods of recession (the shaded vertical red bands) and also who was serving as the state's governor (in black text) and also the timing of when the state implemented major changes in its tax policies (in red text).

As you might expect, we see that recessions are bad for tax collections, that tax collections tend to rise following tax rate hikes and tend to fall after tax rate cuts are implemented.
But changes in tax rates affect more than just state tax collections. They can also impact the relative performance of the state's economy, which can affect the growth rate of its GDP and its level of employment. Our next chart looks at the raw numbers for Wisconsin's state GDP through the fourth quarter of 2013 (the most recent data available from the U.S. Bureau of Economic Analysis).

Our next chart repeats that exercise for the trailing twelve month average of Wisconsin's total employment level for each quarter from 1995 through 2014 as reported by the U.S. Bureau of Labor Statistics.
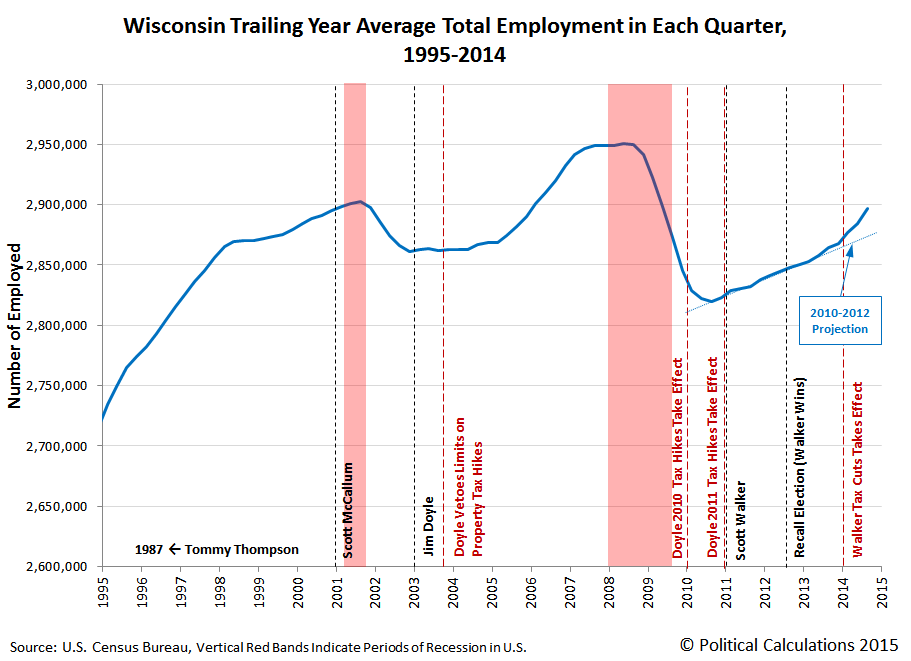
In the employment chart, we've also indicated the trajectory that employment levels in Wisconsin was following after bottoming during the recession, for the period from 2010 through 2012.
One of the more interesting observations that Professor Chinn has provided is that Wisconsin's employment levels have lagged those of both the U.S. and Minnesota during the first years of Governor Walker's first term in office. Chinn however neglects to mention in his comments that Governor Walker faced extreme political opposition to his actions to resolve a massive budget deficit that he inherited from the state's previous governor, Jim Doyle.
Here, Doyle had imposed $2.2 billion of new taxes in his 2009-2011 biennial state budget, with $1.1 billion of that hitting in 2010 and the remaining $1.1 billion increase hitting taxpayers in 2011. A good portion of these taxes was expected to be used to sustain the increased spending benefiting Doyle's political supporters employed in the state's various government agencies and other institutions, such as the University of Wisconsin, which were set to receive a massive, but temporary inflow of funds from President Obama's 2009 economic stimulus program.
That extreme opposition even extended to a number of state senators representing the state's Democratic party, who fled the state rather than to allow votes on measures to restore fiscal balance to the state's government, which effectively shut down the state's legislature and preventing Governor Walker from implementing pro-economic growth measures.
After they did return and Walker was successful in breaking the power of the state's public employee unions, whose interests were being represented by the state senators who acted to flee the state rather than fulfill their responsibilities as elected legislators, they retaliated by forcing a recall election. Combined with the recall of a number of state senators in Walker's political party during the summer of 2011, the combination was enough to block Walker from being able to implement a significant portion of his pro-growth economic agenda during the period covered by Wisconsin's 2011-2013 biennial budget.
Until, that is, after the gubernatorial recall election in June 2012, which Governor Walker won. Following that victory, Walker began to make measurable progress in implementing his long-delayed economic reforms, with both economic growth rates and employment levels picking up considerably after June 2013, which is when Wisconsin's next biennial budget shaped according to Governor Walker's priorities went into effect.
You can see that happen in our next chart showing how the state's year-over-year GDP and employment growth rates have evolved since 1995.

Note that the trend for the state's economic growth tends to precede the trend for the state's employment growth. Note also that the long delay in improvement in the state's GDP and employment levels after Governor Walker's election were a direct consequence of the perverse success that the political opposition to Governor Walker had in obstructing the implementation of the Governor's pro-growth policies, where the interests of public employee unions and other left-wing interests were put ahead of those of regular Wisconsinites.
Now that we've established that the implementation of Governor Walker's preferred economic policies was greatly delayed as a result of the political shenanigans of his opposition, let's look next at a key measure of how the state's tax policies affect its most productive citizens - the average amount of taxes collected per employed Wisconsinite:

This chart confirms that Governor Walker's tax cuts, when adjusted to account for the effect of inflation, have only returned to the level they were during most of the term of the preceding governor, Jim Doyle. Or rather, the part of Governor Doyle's term before he succeeded in imposing that dramatic $2.2 billion worth of tax hikes in 2010 and 2011.
As we noted before, much of the money collected through those new, higher taxes went to benefit Governor Doyle's political supporters employed at various government agencies and at state-funded institutions, such as the University of Wisconsin-Madison, so we'll close on an interesting footnote.
In Fall 2009, the University of Wisconsin-Madison employed 2,017 faculty and 16,507 administrative staff. In Fall 2010, funded in part by Governor Doyle's new taxes and benefiting from President Obama's economic "stimulus", the number of faculty members increased by 10 to 2,027, while the number of administrative staff increased by 836 to 17,343. Since Fall 2011, of the 19,527 faculty, grad students and staff reported as being employed at the University of Wisconsin-Madison, where 2,200 are faculty and another 2,000 or so are grad student/teaching assistants, we can infer that the size of the university's administrative staff has increased to around 17,527, which represents an approximate 1,020 increase in the number of administrative staff since Fall 2009.
Coincidentally, Professor Chinn reports that the University of Wisconsin-Madison's Chancellor Becky Blanks has said that the Governor's proposed reduction in funding for the institution could require it to shed some 1,083 staff positions.
Well, that would be about right, wouldn't it? Just thought we'd take a quick moment to connect the appropriate dots....
Labels: business, economics, education, politics, taxes
Aren't Hollywood actors supposed to be among the most ardent supporters of left wing causes?
And as members of organized labor unions going back for decades, aren't Hollywood actors supposed to be looking out for the interests of those among their ranks who are clearly being exploited for their talent for precious little pay?
So you would think that such ardent supporters of left wing causes and union members would stand in solidarity with their fellow actors to prevent them from having their talent exploited for precious little pay. But you would be wrong, because these same people also believe that hiking the minimum wage will not cost them their jobs, but could potentially shut down the theaters where they work.
An impassioned, two-hour, open-mike meeting about the future of Los Angeles County's small-theater community Saturday at the Renberg Theatre at the Los Angeles LGBT Center in Hollywood drew an overflow crowd of well over 200 theater folks.
With just one exception, the dozens of speakers, including a calmly emphatic Tim Robbins, were motivated by a deep fear of what a proposed higher wage might do to their artistic scene.
Actors' Equity, the national union for stage actors, is seriously considering imposing a $9 hourly minimum wage for its members when they perform or rehearse in L.A.'s small venues.
Robbins and the rest think $9 an hour is exorbitant and that actors should continue working on small stages for what they have been receiving for decades. The going rate is $7 to $15 per performance, depending on ticket prices and seating capacities. Rehearsals, which can consume scores of hours, pay nothing.
Most of the small theaters are nonprofit organizations that need donations to augment ticket sales in order to sustain what's typically a hand-to-mouth existence.
Robbins is the founder and artistic director of the Actors' Gang in Culver City, launched before his 1988 ascent to movie stardom in "Bull Durham."
He stepped to a microphone wearing a pale blue denim jacket and said it made no sense for union officers to expect small theaters to survive under the proposed new terms.
We predict that many of the same actors will soon be calling for new government-funded support for the arts. But then, the government has been funding the arts for decades through government entities like the National Endowment for the Arts, so its kind of difficult to see how that would be anything more than another poorly targeted welfare program. Especially since the NEA has never funded any work that might be considered to be a significant artistic achievement.
Don't believe us? Try to name one work they've funded from the last fifty years that greatly influenced the direction of any form of art in the United States off the top of your head, without turning to Google's search engine to try to dig one up. Then turn to Google and see what stands out to you as the most influential work funded by the National Endowment for the Arts that would be instantly appreciated as such by regular Americans.
Like any bureaucracy that really only looks out for its cronies, they've mainly done mostly wasteful things that, when they have succeeded in drawing an audience of the public, was usually the result of a controversy it needlessly provoked, mainly as a device to attract a public audience in the first place.
But no work of any enduring artistic impact. That's because the artists funded by these government programs neither needed the support of the community nor of commercial audiences. And it shows, because to have an enduring impact, they would have to connect with both.
That's what makes these "exploitative" small theater groups so important and worth preserving. To survive, they have to connect with their audiences and with the communities in which they operate. That's a cauldron that develops the kind of artistic development and subsequent achievement that can stand the test of time.
But that's also a kind of competition that those who are connected with the "right" people on the left don't want to face. Which is why, after so many decades, they're out to close it down. Never mind that everyone who participates in those theater groups volunteers to do it because of how they develop their artistic potential and because of the opportunities they provide to perform.
Even if it means doing two shows a day for $7 to $15 a performance and rehearsing for free!

HT: Mish, who gave us the angle we needed to inspire us to talk about the motion picture business this eyar after we were so sorely disappointed by the reports of how lame the 2015's Academy Awards ceremony was. [Message to the Academy: Joan Rivers was the only one who made watching any portion of the "ceremonies" tolerable - it was a big, bad mistake to snub her among the posthumous recognitions!]
Labels: academy awards, minimum wage
Of all the things we never expected to find ourselves doing, providing policy guidance to the Federal Reserve is probably at the top of the list.
That's all the more unexpected because we've never had any contact with any official at any level of any branch of the U.S.' central banking institution.

And yet, if you listen to the things that a number of the Fed's most influential officials have been saying, you'll find our fingerprints all over them.
It all begins with some key observations and insights we've offered over the years. On that count, our having quantified how the action of investors collectively shifting their forward looking focus from one discrete point of time in the future to another point of time in the future can influence otherwise inexplicable changes in stock prices is likely our major contribution, followed by our observation that the Fed was using stock prices to assess the effectiveness of its monetary policies.
Those two things together allowed us to identify and quantify mistakes made by top Fed officials as they attempted to provide forward guidance to markets. And that, in turn, allowed us to describe how they could repair the damage and more effectively use forward guidance as a monetary policy tool by emphasizing the timing of when the Fed will implement changes using its more traditional arsenal of tools.
The Fed was listening. Now they're applying the lessons they've gleaned from our observations and suggestions.
Over the last several weeks, we've been observing, with increasing frequency, the statements of highly influential Fed officials who have gone out of their way to set the expectation that the Fed will begin hiking short term interest rates above its current 0-to-0.25% level by the end of the second quarter of 2015.
And we know that forward guidance has been effective because of the trajectory that U.S. stock prices has taken during these last several weeks, which becomes even more clear after our simple adjustments to account for the past volatility of U.S. stock prices, which we use as the base reference points from which we can otherwise project future stock prices within a relatively narrow range of noise.
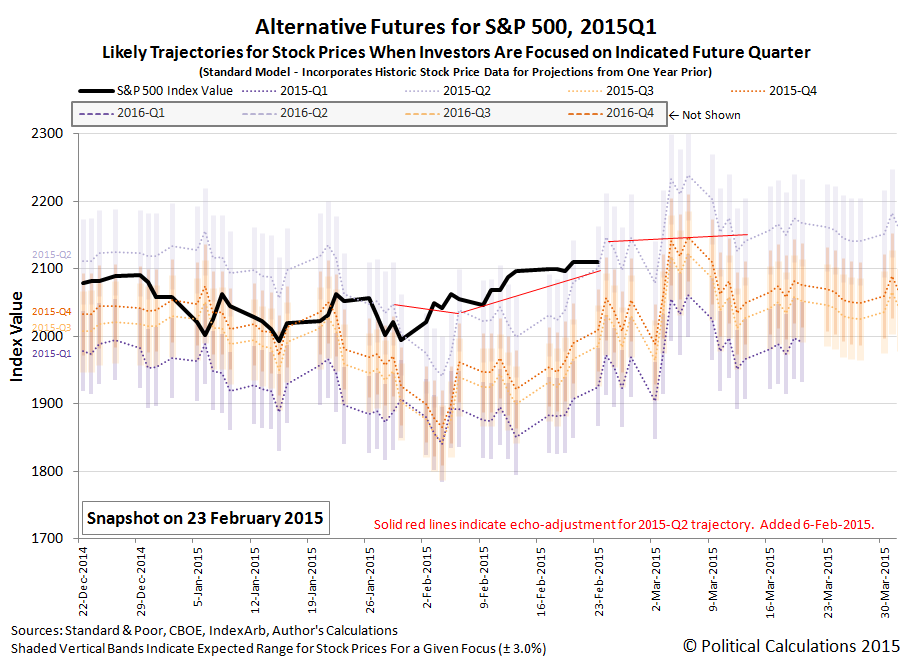
Provided, of course, that we know just how far investors are peering into the future when they make their investment decisions today, which is why we show each of the likely trajectories for investors focused on any of the next four quarters ending in the future. And that's where the Fed's forward guidance efforts come into play, because the Fed's outsized ability to affect interest rates can affect how far forward in time investors look from the present, which then tells us which future trajectory to follow. At least while investors aren't distracted by the alternative futures.

The way that works is that when the Fed says it is going to do something by the end of a certain time period, investors will adapt their investments to be consistent with the expectations for the investment returns that associated with that period of time in the future. We can then tell from the actual trajectory that stock prices follow how tightly investors have set their forward looking focus on the quarter that coincides with the anticipate action on the part of the Fed.
That's the way in which the Fed's forward guidance has been shaped and made more effective, even at the so-called lower zero bound, by our insights and what the Fed has absorbed from our guidance of how to better employ this tool. As long as the Fed's action is considered to be credible given the current state of economic affairs, the Fed can use the model we've developed of how stock prices work as a means of assessing the degree to which markets have bought in to the Fed's preferred policies.
Here, the greater the deviation from the projected trajectory associated with the future point of time to which the Fed has directed investors, the more statements or actions using the other tools the Fed has available to it will be needed to bolster the credibility of its preferred policy. If the gap can't be closed after all that, that provides the indication the Fed needs that it should pursue a different, and more credible, policy.
The best part? It doesn't matter if you've never heard of us or even believe any of what we've just described is possible. It is the way the world works, whether you like it, understand it, or not.
As for what good this does, if you happen to be an investor or just someone who needed more economic stability before you could justify proceeding with plans to expand your business or investments in today's world, you've benefited from the Fed's more effective implementation of its forward guidance policy. As for us and our role in providing guidance to the Fed in implementing those forward guidance policies since mid-2013, you're welcome.
Labels: chaos, economics, satire, SP 500
A lot of lower middle class Americans are just finding out that they will have to pay more income taxes for the 2014 tax year than they expected because they didn't or couldn't sign up for ObamaCare in late 2013 or early 2014.
But for people in that situation, they now have a very important question to answer: "Which do you suppose will cost you more - signing up for government-subsidized health insurance for this year or losing out on getting the Affordable Care Act's tax credit for having health insurance coverage when you file your income tax return next year?"

We can help you answer that question! And as it happens, it's a very timely question that many people need to answer because there's going to be a special health insurance sign-up period for Americans who weren't aware that they were going to get hit with higher income taxes this year because President Obama's political network of community organizers and Healthcare.gov navigators have really dropped the ball on telling people whether they're at risk of getting hit with higher income taxes if they didn't enroll for health insurance last year. That special enrollment period will run from Sunday, 15 March 2015 through Thursday, 30 April 2015.
But here's the thing - depending upon how much your income is, for people who can reasonably expect to be healthy through the end of 2015 and not really need health insurance at all during the year, you can end up paying way more for your Obamacare health insurance coverage than what you might otherwise have to pay on your income taxes. It might actually make a lot more sense for you financially to not sign up for coverage now and to then reconsider your situation later this year when the health insurance signup period for 2016 begins on 1 November 2015.
And that's assuming that you don't consider the real and affordable alternatives to signing up for Obamacare's government-subsidized health insurance to be more attractive.
Let's talk about the numbers that you'll need to weigh your decision. First, you'll need to identify your annual income, which for many people, is something they can get from their income tax returns for 2014, which must be in the mail no later than Wednesday, 15 April 2015, so it's an easy number to get.
Next, you'll need to shop for the health insurance plan through your state's or the federal government's health insurance "marketplace", which will ask you to enter your annual income and will tell you how much your subsidized monthly premium (or rather, your monthly bill) for health insurance coverage will be for the option you select.
Then enter those numbers in the tool below. Our tool also asks you to indicate how many adults or children would be covered by the health insurance and to identify your state so we can sort out whether your income is low enough to qualify for health insurance coverage through the government's Medicaid program, which would mean you don't have to worry about having to pay higher income taxes.
It's that simple - we'll have some more discussion after our tool's results.
What we find for our default example, where a relatively low income earning single individual would only pay $99 per month for subsidized health insurance through the Obamacare exchanges, is that it makes much more sense for this individual to not buy the health insurance and pay their higher income tax bill instead.
But that won't be true for all individuals - there are times when it would make more sense, purely from a financial point of view with respect to the total amount of additional taxes and the annual cost of just the insurance premiums they might pay, where it would make more sense to buy the subsidized health insurance.
Warning: For those of you who do choose to sign up for Affordable Care Act subsidized health insurance, please be aware that if you earn more income in 2015 than the amount you indicated when you signed up for that coverage (such as if you get a raise or change to a higher paying job), the amount of your Obamacare tax credit will be considerably lower, which means that your income tax bill will be considerably higher when you file your taxes next year. So if you do make more money than that this year, make sure you have an additional amount of money to cover the cost of your higher income tax bill withheld from your paychecks in 2015.
If that's your situation, we have another tool to help you do the math for that too!
About This Tool
This tool is based on our more generic "ObamaCare: Should You Pay the Premium or the Tax?" tool, which is updated annually - this version specifically and only applies for the 2015 tax year.
Legal Disclaimer
Materials on this website are published by Political Calculations to provide visitors with free information and insights regarding the incentives created by the laws and policies described. However, this website is not designed for the purpose of providing legal, medical or financial advice to individuals. Visitors should not rely upon information on this website as a substitute for personal legal, medical or financial advice. While we make every effort to provide accurate website information, laws can change and inaccuracies happen despite our best efforts. If you have an individual problem, you should seek advice from a licensed professional in your state, i.e., by a competent authority (such as a licensed insurance broker, medical professional or legal services provider) with specialized knowledge who can apply it to the particular circumstances of your case.
Note that we didn't include "Healthcare.gov Navigator" or "community organizer" in the category of "competent authority".
Labels: health care, personal finance, taxes, tool
What the world needs now is a better snow plow. Imagine what it would mean for state and local transportation departments to be able to clear two lanes of road with just one vehicle, rather than the one vehicle per lane method in widespread use today. Now, meet the future as envisioned by now-retired Missouri DOT engineer and inventor Bob Lannert (HT: Core77):
Core77 describes the benefits of the TowPlow system:
As we saw in the rooftop snow removal post, getting rid of the white stuff provides unique design challenges for individual snow-clearers. And those challenges grow exponentially when spread over the community level. When entire towns and highways are buried under snow, local officials are tasked with an economic problem: How can we remove as much snow as quickly as possible while using the least amount of resources? Every hour of every day that a road remains unplowed, the local economy suffers; yet there are only so many plows, drivers, and fuel to spare, and there may be another storm coming next week, meaning resources have to be carefully managed.
[...]
The units aren't cheap—we found conflicting sources online indicating they cost anywhere from $67,000 to $100,000—but with states spending millions of dollars on diesel fuel each year to clear snow, the TowPlow is still a no-brainer investment. "TowPlows can pay for themselves the first year in many states," the company claims, and the math adds up: While it increases the fuel consumption of the vehicle towing it by 10-15%, that's still an 85-90% savings over having two vehicles do the work.
Lannert's home state of Missouri now has more than 130 TowPlows in their fleet, and found that they do such a good job of clearing the snow that less salt needs to be sprayed on the roads. That also adds up to a savings. "For every ton of salt we don’t use in the winter, that’s a ton of asphalt we can use in the summer," Missouri DOT Maintenance Superintendent Mike Belt told The Missourian, pointing out that the two materials have similar pricing.
As Tyler Cowen might observe, there is no great snowplow stagnation!
Labels: technology
Every three months, we take a snapshot of the expectations for future earnings in the S&P 500. As we'll show you today, expected earnings per share for the S&P 500 throughout 2015 have plummeted from the levels that Standard and Poor had projected they would be back in November 2014.

The table below quantifies the carnage for what can now be described as the very sudden onset of an earnings recession, one that is currently forecast to run through the third quarter of 2015:
| Expected Future Earnings per Share for the S&P 500 | |||||
|---|---|---|---|---|---|
| Future Quarter | 2014-Q4 | 2015-Q1 | 2015-Q2 | 2015-Q3 | 2015-Q4 |
| On 13 November 2014 | $109.96 | $118.23 | $124.48 | $131.07 | $134.89 |
| On 15 February 2015 | $102.89 | $103.34 | $103.77 | $105.00 | $112.83 |
| Change in Expectations | -$7.07 | -$14.89 | -$20.71 | -$26.07 | -$22.86 |
Much of the decline in earnings expectations is tied to the decline in global oil prices, which primarily affects the oil industry, and also affects the business outlook for financial institutions and capital equipment manufacturers.
It is also interesting to note a comment by S&P's Howard Silverblatt regarding the extent to which a significant number of companies in the S&P 500 have reduced the number of shares that are outstanding in the market:
Q1, Q2 and Q3 2014 had 20% of the issues, 1-in-5, reducing their year-over-year share count by at least 4%, therefore adding at least a 4% tailwind to their current EPS.
If not for those actions to reduce the number of outstanding shares in the market in 2014, the earnings per share data would appear far worse, and the outcome for 2014-Q4, for which earnings are still in the process of being reported, would be even more negative. The same would be true for the index' dividends per share.
More significantly, since expectations for dividends per share are the primary driver for stock prices, it would be safe to say that the outcome for stock prices in 2014 would not have been as positive as they turned out to be in the absence of such financial engineering.
Data Source
Silverblatt, Howard. S&P Indices Market Attribute Series. S&P 500 Monthly Performance Data. S&P 500 Earnings and Estimate Report. [Excel Spreadsheet]. Last Updated 15 February 2015. Accessed 18 February 2015.
Labels: earnings, recession, recession forecast, SP 500
How much might President Obama's executive action to "legalize" the immigration status of an estimated 5 million non-U.S. citizens who unlawfully entered the United States cost U.S. taxpayers?
That's not a difficult question to answer because President Obama has already told us how much he expects his potentially unconstitutional executive action will cost U.S. taxpayers through the budget of the U.S. government. [Note: These costs do not include the costs that will be incurred by state or local governments in the U.S.]
Specifically, we can find the answer by taking President Obama's spending requests for a number of welfare programs in his latest budget proposal, for the federal government's 2016 fiscal year, and subtracting the amount of money he requested to be spent on these programs in the years overlapping his budget proposal for the 2015 fiscal year.
The chart below reveals what we found when we did the math for the years 2016 through 2019, which are the ones that would be most affected by the President's executive action, as the amount spending for the federal government's 2015 fiscal year is almost completely locked in at this point in time:

What's most important to recognize in this data is that the amount of spending for these welfare-related expenditures is directly tied to the health of the U.S. economy. Each of these expenditures will generally rise and fall together when the U.S. economy is going through periods of economic expansion or contraction, as large numbers of Americans either enter or exit welfare programs.
But what the data shows in the chart above is contradictory. President Obama's budget request for Unemployment Compensation points to a growing economy, while all the other welfare programs would seem to indicate a deep recession.
Since President Obama has recently stated that the economy is growing, a declining economy cannot be the explanation for the President's request to expand the federal government's welfare spending.
There are two other possibilities that could potentially explain the increase in spending for these welfare programs. First, the President could be massively increasing the amount of welfare benefits that will be given to each current welfare recipient. Second, the President could be proposing to massively increase the number of people who are eligible to collect welfare benefits.
President Obama's executive action to permanently defer deportation proceedings for over five million undocumented immigrants and to provide them with work visas would account for the increase in spending proposed for these welfare programs. The largest expansion would be the eligibility of these individuals to collect the Earned Income Tax Credit (covered under "Other income security"), with food stamps ("Food and nutritional assistance") following close behind. Here's how much President Obama's combined proposed spending on all these welfare programs outside of Unemployment Compensation changes in each year from 2016 through 2019, along with the amount of benefits that each individual covered by the President's executive amnesty would receive if equally divided among five million individuals:
- 2016: $1.708 billion ($ 341.60 per person)
- 2017: $18.417 billion ($3,683.40 per person)
- 2018: $19.236 billion ($3,847.20 per person)
- 2019: $17,229 billion ($3,445.80 per person)
Since it's unlikely that all of the 5 million individuals expected to be covered by President Obama's executive action would be eligible for these welfare programs, the welfare benefit amount per actual recipient would be larger than these figures. We should also note that these figures do not also include spending for Medicaid's health care services that these individuals would also be eligible to benefit from, since we do not have the data to split out the immigrant population from those who are being added to the rolls for that welfare program through the Affordable Care Act.
Immigrants requesting amnesty from deportation are charged an application fee of $485 per person, which consists of a $380 fee for processing their employment authorization application and $85 for collecting their fingerprints.
That's quite a return on investment for undocumented immigrants who would become both eligible for, and dependent upon, these U.S.' welfare assistance programs as a result of President Obama's executive action. At least, if we are to go by the amount of money requested by President Obama for these programs in his FY2016 budget proposal.
Data Sources
White House Office of Management and Budget. Historical Tables, Budget of the United States Government, Fiscal Year 2016. Table 3.2 - Outlays by Function and Subfunction: 1962–2020. [Excel Spreadsheet.] 2 February 2015.
White House Office of Management and Budget. Historical Tables, Budget of the United States Government, Fiscal Year 2015. Table 3.2 - Outlays by Function and Subfunction: 1962–2019. [Excel Spreadsheet.] 4 March 2014.
Labels: economics
We found an interesting correlation between how Brent crude oil prices have changed and the value of the S&P 500 since the beginning of 2015:
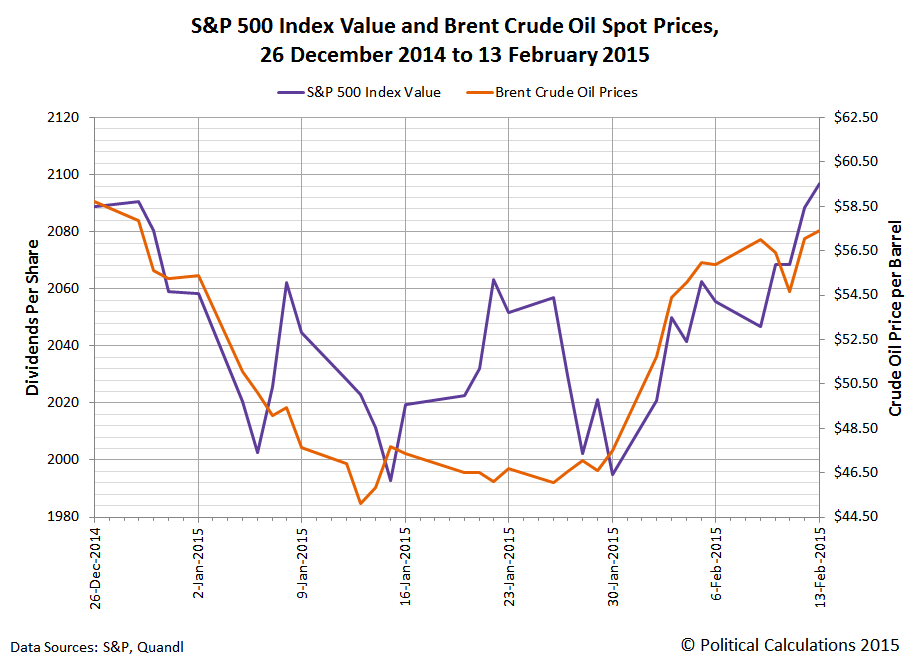
If one were to consider Brent crude oil prices as a significant driver of the stock market, the two large deviations in stock prices with respect to the trajectory of oil prices might be described as speculative rallies that didn't pan out - they weren't supported by fundamentals.
And perhaps the best evidence for that hypothesis to to see how the expectations for future dividends per share evolved with respect to the trajectory of Brent crude oil prices:
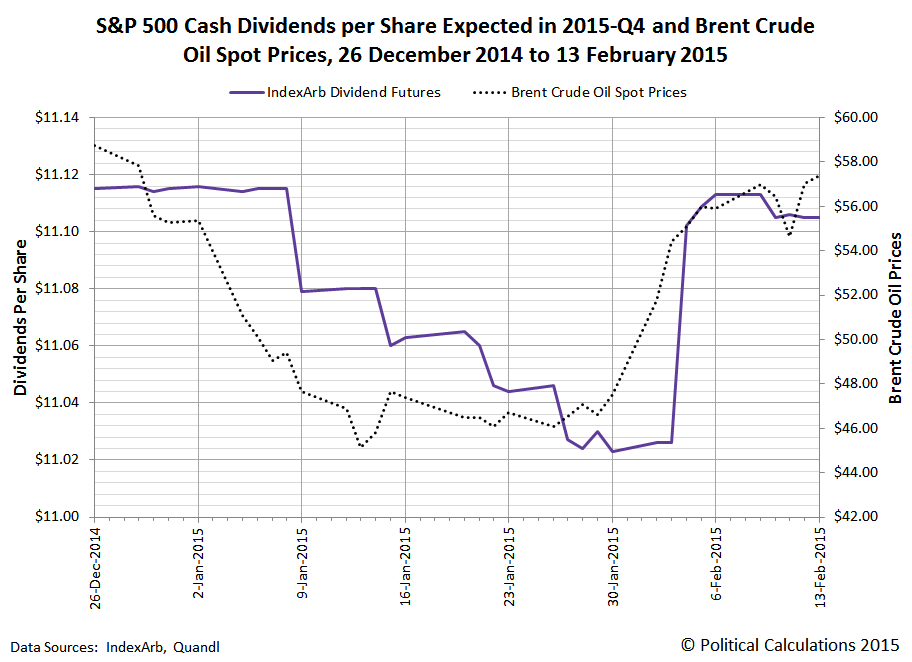
Hope this helps clarify the third comeback rally for stock prices in 2015 would seem to have some legs!
Labels: SP 500, stock market
Let's start today's diversion into technology with the answer to the question "Why steel?"
Steel has long been the backbone of human civilization, the very crucible in which industrial progress has been forged. From the skylines of our cities to the vehicles that crisscross the globe, steel is universal. Steel leverages the natural abundance and low cost of iron to produce a wide variety of properties and performance and has dominated the materials spectrum in transportation, oil & gas and infrastructure since the middle of the 19th century.
So what's wrong with steel? Well, in a world full of water, when it gets exposed to the liquid, it eventually corrodes and rusts. Unless you go to a lot of time, effort and cost to coat or protect the surfaces of a steel object to prevent rust from forming or to alloy it with costly rust-inhibiting elements, steel breaks down and eventually leaves behind powdery deposits of rust.
But what if you could use a laser to etch the surface of your economically produced steel parts to make them repel water and thus, supernaturally rust repellent.
Lasers. Is there anything they can't do?
HT: Core77
Labels: technology
Say what you will about the relationship between atmospheric carbon dioxide and increasingly questionable global temperature trends, perhaps the detailed scrutiny on the growing amount of carbon dioxide in the Earth's atmosphere over the modern era can perhaps be directed toward a positive purpose: measuring the state of the global economy!
Here, we calculated the trailing twelve month average of the year-over-year change in the parts per million concentration of carbon dioxide in the Earth's atmosphere, as measured at Mauna Loa, in the middle of the Pacific Ocean, far away from the Earth's major centers of economic activity, and juxtaposed that data with the incidence of recessions in the United States.
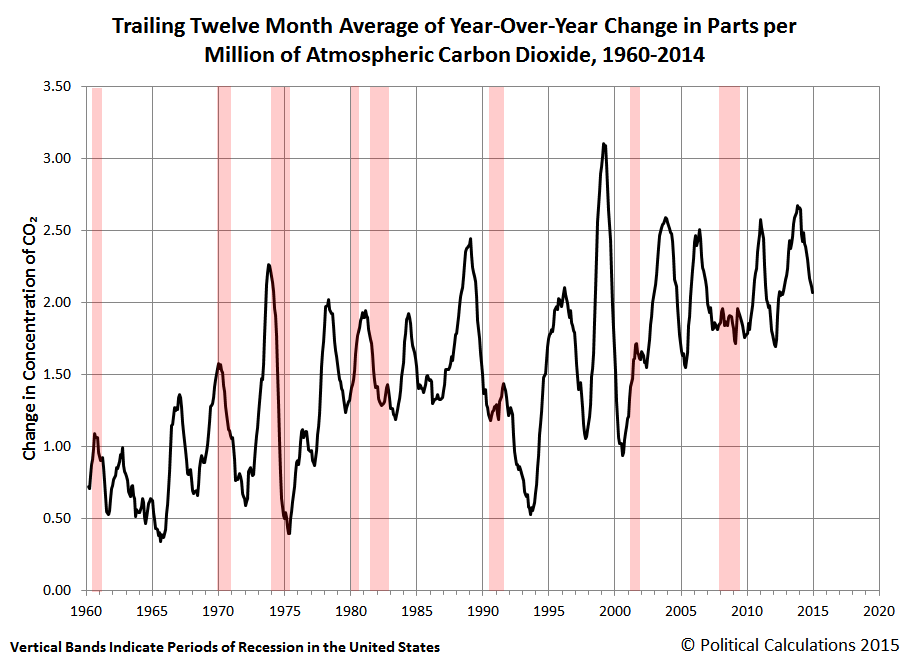
The amazing thing that we see coming out of this juxtaposition is that it would appear that the trailing twelve month average of year over year changes in carbon dioxide levels in the Earth's atmosphere would appear to be somewhat well correlated, in real time, with the incidence of recessions in the U.S. economy, which we see in either a falling or flat level of increase in CO2 in the Earth's atmosphere.
That makes sense in that a contracting economy is likely to reduce its energy consumption which, in our largely fossil fueled world, produces a negative change in the amount of carbon dioxide in the Earth's atmosphere. Meanwhile, a growing economy is likely to produce a positive change in the measured amount of carbon dioxide.
However, the incidence of U.S. recessions does not correlate with all of the downturns in the year-over-year change in CO2 concentrations.
It occurs to us that these downturns in might be correlated with significant recessions elsewhere in the world. For example, the very large dip after 1992, which shows up after the U.S. has passed through a period of recession, would correspond to the economic distress that resulted from the collapse of the Soviet Union, which did not meaningfully affect the U.S. economy at the time, but most certainly affected a very large region in the world.
We suspect that this kind of correlation can be done to explain the other downturns, where events like Germany's, Australia's and New Zealand's 1967 recessions, or the one-two punch combination of Germany's 1996 recession that was followed by the 1997 Asian Financial Crisis. The challenge is that from what we can tell so far, there isn't a comprehensive listing of when and where recessions or other economic downturns have occurred throughout the world, which would make a full correlation difficult to produce.
In the meantime though, we also suspect that a downturn in the year-over-year change in CO2 is signaling that there is some significant economic distress occurring somewhere in the world. And these days, that's much more likely to be China than the U.S.
So in case you were wondering about what's behind that latest downturn in the year-over-year growth of atmospheric CO2 levels....
Labels: economics, environment, recession
Greece's new Prime Minister, Alexis Tsipras, has begun to lay out more detailed proposals to address Greece's economic situation, in which the nation finds itself both unable to pay back the money it has been borrowing to keep its government afloat and to grow its economy. We've excerpted the major initiatives that are within the new Greek government's ability to achieve below:
(Reuters) - Leftist Prime Minister Alexis Tsipras laid out plans on Sunday to dismantle Greece's "cruel" austerity program, ruling out any extension of its international bailout and setting himself on a collision course with his European partners.
In his first major speech to parliament since storming to power last month, Tsipras rattled off a list of moves to reverse reforms imposed by European and International Monetary Fund lenders: from reinstating pension bonuses and cancelling a property tax to ending mass layoffs and raising the mininum wage back to pre-crisis levels....
Greece would achieve balanced budgets but would no longer produce unrealistic primary budget surpluses, he said, a reference to requirements to be in the black excluding debt repayments....
In a bid to show he was serious about avoiding a new upward spiral in public spending, Tsipras announced a series of cuts to make the government leaner by trimming ministerial benefits like cars and selling one of the prime minister's aircraft.
He also outlined plans to crackdown on tax evasion by targeting the rich and pledged public sector contracts would no longer favor oligarchs, a move that is likely to make him popular among the many Greeks fed up of a state they believe serves the wealthy.
Taking each of the items in order.
Reinstating Pension Bonuses

This refers to a popular program in which the Greek government provides an extra payment coinciding with the Christmas holiday to retired individuals with low public (think "Social Security") pension incomes. As such, it represents more red ink to the Greek government's fiscal situation, since the payments would likely not be tied to the country's economic performance.
If it were however, say through Greece's new Finance Minister's proposal to issue government bonds with payments linked to the country's GDP growth, then it becomes a very interesting way to align the interests of Greece's pensioners with economic growth-oriented reforms.
Cancelling a Property Tax
While Greece's tax hikes of recent years have clearly damaged its economy, cutting Greece's recently hike property tax will provide some benefit because of the GDP multiplier effect. A benefit that would be largely lost if Tsipras' government intends to impose a new property tax on large properties in its place.
Meanwhile, Tsipras is missing the opportunity to undo the greater damage that was caused by hiking Greece's Value Added Tax (VAT) in 2011, where reducing and simplifying this tax would provide a more immediate benefit to long suffering Greek consumers.

Instead, Tsipras' is proposing to selectively cut the VAT on some basic items, while imposing new consumption taxes on perceived "luxury" items and otherwise continuing to enforce Greece's VAT at its higher confiscatory rate, which really seems to be the primary way the Tsipras' government will go after the two-thirds of Greek citizens who underreport their incomes to the government to avoid paying Greece's income taxes.
Perversely, that dynamic is perhaps what incentivizes an increasing number of Greeks to engage in income tax evasion - doing so allows them to be able to afford to buy the things whose prices have been jacked up by Greece's Value Added Tax. There is, after all, a reason why the percentage of Greeks now engaging in tax evasion has increased from the much lower level of tax evasion recorded in 2006.
Oh, by the way, if the example of the U.S. in attempting to tax "luxury" items in the past is any indication, those new taxes will instead cause job losses and hurt GDP growth, erasing the benefits from the proposed cuts in the value added tax rates for selected items.
Ending Mass Layoffs
The mass layoffs Tsipras is pledging to end are those of government workers. As the head of a coalition of radical and leftist political groups, this action is required of Tsipras by his main constituency and likely cannot be avoided, even though government workers are largely responsible for Greece's deteriorating fiscal situation given the parasitic effects of the regulations and other barriers they impose upon genuinely productive economic activity through their widespread corruption.
Like poor pensioners, Tsipras needs to align the interests of government workers with the positive growth of the Greek economy, and to achieve that, Tsipras need to link any bonus payments they might receive as part of their compensation as well as their entire public sector pensions to the nation's current and future GDP growth. Once again, we would suggest that might be achieved through the mechanism of GDP-linked bonds. Otherwise, the action of rebloating Greece's government bureaucracies would be little different from adding large lead weights to the decks of the Titanic.
Raising the Minimum Wage to Pre-Crisis Levels
Unless the new Greek government's is capable of executing a plan to initiate a period of hyperinflation in the Greek economy, this is perhaps the most economically harmful proposal put forward by Tsipras. To understand what that means for Greece, the chart below shows the minimum wages that apply in Greece and all the nations in close geographical proximity to Greece.
In one fell swoop, Tsipras' proposed 28% increase in Greece's minimum wage would reestablish its former position of having the highest minimum wage in the eastern Mediterranean. If the recent experience of the U.S. in hiking its minimum wage during a period of recession is any indication, Greeks, and particularly young Greeks, should expect significant job losses as a consequence of the action in the absence of considerable real economic growth or inflation to offset its negative impact.
There's one other factor to keep in mind. The U.S. economy only experienced its strongest economic growth of the past decade as it suddenly began generating significantly more jobs at the very lowest end of the income spectrum in the second half of 2014, which could have been even greater if not for the local minimum wage hikes that were imposed in its largest population state.
For a nation that desperately needs to grow its GDP, imposing an arbitrary policy that only makes it harder for the least skilled, least educated and least experienced portion of its population to earn the incomes they are capable of earning must be considered a self-inflicted wound. Likewise, for a nation that desperately needs to reduce its spending on social welfare programs, imposing an arbitrary policy that would actually increase the amount of social assistance spending required of it to compensate for its heavy hand in denying people from being permitted to work at whatever wage level at which they might voluntarily agree to work is beyond stupid.
Balanced Budgets, But No Primary Budget Surplus
A primary budget surplus is one in which the government collects enough revenue to pay for all its outlays, not including any net interest payments on its debt. For a nation with a large amount of outstanding debt relative to its GDP, running a primary budget surplus is necessary to reduce its debt burden.
What Tsipras is saying here is that Greece cannot afford to do this, and for a country that is effectively bankrupt, he's right.
Whether Tsipras can do so depends upon whether and how much relief he can secure from Greece's main creditors in Europe. But if Greece ultimately defaults on its debt payments in the absence of a such a deal, then his government will be forced into running a primary budget surplus, whether he wants to or not.
To do that however would require cutting government spending to levels last seen in 2005 given the country's current tax laws and GDP per capita:
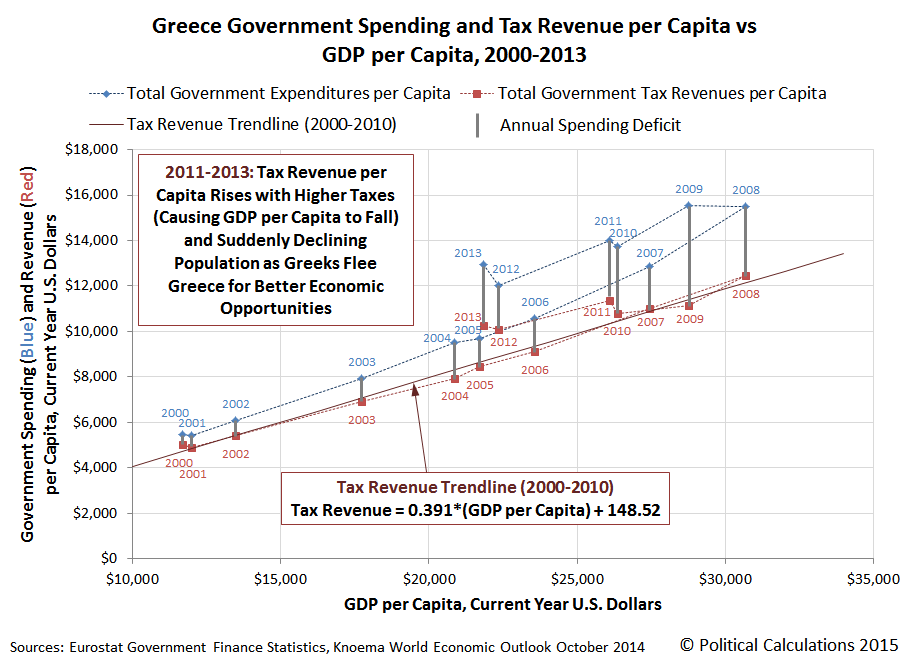
Very do-able, particularly if the amount of government spending above revenue at the country's current GDP per capita is going to pay off Greece's creditors.
Cracking Down on Tax Evaders
Look at that last chart again, particularly the trajectory of government revenues (taxation). Does it look like the Greek government really has a problem in collecting higher amounts of taxes from its citizens given its GDP per capita? Or does it have a problem in setting its expectations for tax collections too high to support the amount of spending promised by its politicians with respect to the amount of taxes that it can actually collect?
Otherwise, we suspect that Tsipras' government most visible actions will be to prosecute high profile tax evaders, particularly if they're wealthy, which will help distract how its actually going to go about making the vast majority of Greece's tax evaders pay - through Greece's Value Added Tax.
Trimming Government Ministerial Benefits and Selling Government Property
Hear, hear. Tsipras shouldn't stop with just the ministers' benefits - Greece's bureaucrats have excessively generous benefits that can be cut, or better, reformed to be both proportionate to what someone in Greece's private sector earns and affordable as well. That's especially important because it would free up money that Tsipras proposes to spend by bringing back so many previously dismissed bureaucrats onto the public payroll/dole. We would suggest implementing a defined contribution pension plan, where GDP-linked government bonds are the only investment option for all public sector employee pensions, with a one-time 75% haircut on any defined benefit pensions they have as reparations for the economic destruction wrought by their corrupt acts.
Meanwhile, selling unneeded or low-use assets held or owned by the Greek government is an exceptionally good idea. Tsipras shouldn't stop with just the PM's jet, but should extend the sale to assets wastefully employed by lower level bureaucrats in his government.
Labels: economics
Welcome to the blogosphere's toolchest! Here, unlike other blogs dedicated to analyzing current events, we create easy-to-use, simple tools to do the math related to them so you can get in on the action too! If you would like to learn more about these tools, or if you would like to contribute ideas to develop for this blog, please e-mail us at:
ironman at politicalcalculations
Thanks in advance!
Closing values for previous trading day.
This site is primarily powered by:
CSS Validation

RSS Site Feed
JavaScript
The tools on this site are built using JavaScript. If you would like to learn more, one of the best free resources on the web is available at W3Schools.com.
Other Cool Resources
Blog Roll


