
It's summer and the weather will be great this weekend. It's the perfect time to host a cookout with enough food to feed ten hungry people. How much will it cost to feed all of them in 2026? And how does that compare to last year? Or the year before? Or for that matter, five years ago?
To find out, the American Farm Bureau Federation sent volunteers out grocery shopping for a summer cookout with a list of ten items. The same ten items they send shoppers out for every year when summer arrives. This year, they found the bill for their ten summer cookout items tallied up to $73.82, which is $2.90 or about 4.1% more than 2025's grocery bill. It's also $2.60 or 3.7% more than 2024's summer cookout cost.
Five years ago however, things were really different. Back then, all the Farm Bureau's summer cookout items cost a total of $59.52. That's $14.30 less than they do in 2026.
Summer 2021 however came at the beginning of a period of high inflation was unleashed by the Biden administration. Food prices shot up by 17% by Summer 2022 and by the time Summer 2024 came around, they were 20% higher than they had been in 2021.
The following interactive chart shows how much each individual menu item in the Farm Bureau's summer cookout menu cost in each year from 2021 through 2026. If you're accessing this article on a site that republishes our RSS news feed, you may need to click through to our site to see the chart, which we created using Datawrapper.
The next chart better shows the trends for each of the individual summer cookout menu items:

Most items surged between 2021 and 2022 with inflation. However, only three of the ten items have shown a general upward trend from year to year since: ground beef, hamburger buns, and ice cream.
Two of these items fall into the category of beef or dairy products. These costs have been rising because of the decline of U.S. cattle and dairy herds as a result of drought conditions in 2023-2024, where cattle ranchers and dairy farmers had to make hard choices to reduce the number of cows they raise because of the drought's impact on pastureland and shortages of feed, which has inflated the costs to raise both beef and dairy cattle.
The drought conditions that shrank U.S. beef and dairy cattle herds will have a years-long impact. Even though drought conditions eased in 2025, because it takes about three years to raise cattle for beef production, it will likely be well into 2027 or in 2028 that Americans would reasonably expect see beef prices come down as supply recovery takes place.
Meanwhile, global shortages of wheat from ongoing geopolitical events like the ongoing Russia-Ukraine war are a leading factor behind the rise in bread prices in recent years. In all these cases, reduced supply coupled with continued strong demand has contributed to rising prices.
In an interesting development, the Trump administration announced earlier this week that Walmart will lower the cost of several barbecue essentials by 15%. Walmart has confirmed its price rollbacks, noting the price of one pound of 73% ground beef roll will fall from $6.74 to $5.94, a savings of $0.80 (or about 12%) per pound. For the two pounds of hamburger on the Farm Bureau's summer cookout menu, this change alone would lower the cost of a summer cookout in 2026 by $1.60 to $72.22, making it just a dollar more expensive than it was in 2024.
Walmart is also reducing its price of an 8-ounce package of Lay's Classic Potato Chips from $2.97 to $2.50, which if we double to match the Farm Bureau's 16-ounces of potato chips on its menu, would further reduce the summer cookout cost by an additional $0.94. The combination of price reductions for just these two items would put the cost of a summer cookout in 2026 at $71.28, just $0.06 above what it cost in 2024.
Image credit: Some meat on a grill in the garden during summer photo by Marc Kleen on Unsplash.


Thanksgiving has a defining theme in 2025. The population of turkeys raised on U.S. farms shrank from the previous year. The size of those live turkeys also shrank. Completing the trifecta, the Farm Bureau Federation confirms the price of a Thanksgiving dinner has shrunk as well, led lower by a big drop in the price of turkeys!
That cost had peaked at $64.05 for a 10-item menu in 2022 thanks to the runaway inflation unleashed by the Biden-Harris administration. Since then, the cost has dropped each year, falling to $61.17 in 2023 and to $58.08 in 2024. This year, that cost dropped 2.9% to $55.18.
The Farm Bureau describes how a drop in the price of turkeys contributed to 2025's lower Thanksgiving dinner cost:
The centerpiece on most Thanksgiving tables – the turkey – dramatically decreased in price, which helped bring down the overall cost of dinner. The average price for a 16-pound frozen turkey is $21.50. That is $1.34 per pound, down more than 16% from last year. While the wholesale price for fresh turkey is up from 2024, grocery stores are featuring Thanksgiving deals and attempting to draw consumer demand back to turkey, leading to lower retail prices for a holiday bird....
“It’s encouraging to see some relief in the price of turkeys, as it is typically the most expensive part of the meal,” said AFBF Economist Faith Parum, Ph.D. “Farmers are still working to rebuild turkey flocks that were devastated by avian influenza, but overall demand has also fallen. The combination will help ensure turkey will remain an affordable option for families celebrating Thanksgiving.”
Here's the Farm Bureau's infographic indicating each of the menu items for their Thanksgiving dinner and the average prices they found them when they shopped for them during the first week of November 2025:

Although turkeys are much less costly for American consumers, they found both increases and decreases in the prices of several items compared to last year.
Half of the ingredients in the survey declined in price, including dinner rolls and stuffing. Low wheat prices helped bring down the cost of items requiring flour.
Items like fresh vegetables and sweet potatoes increased – a veggie tray is up more than 61% and sweet potatoes are up 37%. Natural disasters partly contributed to the increase. For example, North Carolina, which is the largest grower of the nation’s sweet potatoes, suffered hurricane damage. Additionally, fresh produce prices tend to be highly volatile, and even modest supply-chain disruptions, from weather, labor shortages, transportation delays or regional production setbacks, can trigger sharp, short-term spikes in prices. The continued shortage of farmworkers and rapidly increasing farm wages also played a role in rising produce costs. It’s important to note that fresh vegetables and potatoes are traditionally low-cost items, so an increase of just a few cents can dramatically affect the cost change percentage year-to-year.
Here are the average prices of the Farm Bureau's Thanksgiving dinner menu items with their percentage and dollar changes in cost from 2024 to 2025:
- 16-pound turkey: $21.50 or $1.34 per pound (down 16.3%, or -$4.17 for the whole turkey)
- 14-ounces of cubed stuffing mix: $3.71 (down 9%, or -$0.37)
- 2 frozen pie crusts: $3.37 (down .8%, or -$0.03)
- Half pint of whipping cream: $1.87 (up 3.2%, or +$0.06)
- 1 pound of frozen peas: $2.03 (up 17.2%, or +$0.30)
- 1 dozen dinner rolls: $3.56 (down 14.6%, or -$0.60)
- Misc. ingredients to prepare the meal: $3.61 (down 4.7%, or -$0.14)
- 30-ounce can of pumpkin pie mix: $4.16 (up .1%, or +$0.01)
- 1 gallon of whole milk: $3.73 (up 16.3%, or +$0.52)
- 3 pounds of sweet potatoes: $4.00 (up 37%, or +$1.07)
- 1-pound veggie tray (carrots & celery): $1.36 (up 61.3%, or +$0.52)
- 12-ounce bag of fresh cranberries: $2.28 (down 2.8%, or -$0.07)
Overall, the $55.18 cost of a Thanksgiving dinner in 2025 is $8.87 or about 14% lower than in 2022.
References
Farm Bureau Federation. Cost of Thanksgiving Dinner Declines. [Online article]. 19 November 2025.
Farm Bureau Federation. Cost of Thanksgiving Dinner Declines – Remains Higher Than Pre-Pandemic Levels. [Online article]. 20 November 2024.
Labels: food, thanksgiving

Summer is a season for hamburgers. But when it's hot and humid out, how much time do you want to spend outside grilling hamburgers? How fast can you fully cook a hamburger patty?
That seems like a simple question, but if you want to use math and the physics of heat transfer to work out the fastest way to cook your hamburgers, it presents a lot of variables you have to take into account. Unless, that is, you simplify the problem in ways that can eliminate them.
For instance, how fast a hamburger cooks will be influenced by the shape of the patty to name just one factor. You could go for a traditional disc-shaped patty or even a Wendy's-style square-shaped patty. But how those burgers cook will be influenced by how heat from the grill 'wraps' around them even as it cooks through the meat from below. It's not hard to have the edges of a burger be the most well-done portion of it, but that may mean the inside of the burger isn't as well-cooked as you might like. How can you ensure your burger is evenly cooked?
For a mathematician or physicist, one way to remove the patty shape as a variable is to assume the burger will be grilled on an infinite plane that only allows the meat to be exposed to heat from the grill on one side at a time. With that assumption, you can count on having the burger be cooked evenly through at all parts. When you do that, you also simplify the problem to be one in which the only variable you have to consider is how often you will flip the burger while cooking it.
That's what one mathematician did in a paper published earlier this year. Here's a plain English summary of what they found when they did the math:
Craving a hamburger but in a hurry? If you wish to find out the quickest way to cook a patty, mathematics can actually help you.
Jean-Luc Thiffeault, a professor of applied mathematics at the University of Wisconsin in Madison, has found that the timing between flips and the number of flips hold the key to the fastest way to cook a meat patty. Moreover, increasing the frequency of flips reduces cooking time by nearly a third.
In his study, published in Physica D on June 17, the researcher used mathematics to study how heat moves through a slab of meat, which simultaneously cooks on the bottom side and cools on the top until the meat is flipped. Eventually, his analysis showed that flipping the patty heats the meat evenly, therefore speeding up the cooking process. He also found that more flips lead to faster cooking.
According to the study, a theoretical 1-centimeter-thick patty that's flipped just once is cooked in 80 seconds. On the other hand, flipping it 10 times at intervals ranging from six to 11 seconds results in a cooking time of only 69 seconds. A maximum decrease of 29% in cooking time is then observed when the patties are continuously flipped.
However, after a threshold is reached, the effect of the number of flips on cooking time becomes inconsequential.
"After three or four flips, the gain in time is negligible," Thiffeault said.
But that's for flipping a burger that fills a grill whose surface is an infinite plane. How does that compare with real-world burger flipping?
As it happens, someone has flipped enough real-world burgers to verify the math-only results:
The study's findings resonate with the observations chef and food writer J. Kenji López-Alt shared in a 2019 article. In the said piece, López-Alt compared the time it took for a burger's internal temperature to reach about 52° Celsius using a certain cooking method he followed. He then realized that flipping the patty every 15 seconds, compared to just once, shortened cooking time by nearly a third.
So there you have it. Flipping a patty once every 15 seconds will get your burgers cooked through about as fast as you can hope to cook it. How many flips you need will ultimately come down to how well-done you want your burgers to be cooked.
Image Credit: A person is grilling a hamburger on a grill photo by Amirhossein Shirdelan on Unsplash.

How much will it cost to feed 10 hungry people at a summer cookout in 2025?
The American Farm Bureau Federation went grocery shopping for a summer cookout to find out their menu costs in 2025. They report their volunteer shoppers found the 10 items they went out to buy cost $70.92. The price is down by 30 cents from the $71.22 they reported last year, but is up 19% from what Americans paid for the same items five years earlier.
Most of that increase has taken place since 2021. The following interactive chart shows how much each individual menu item in the Farm Bureau's summer cookout menu cost in each year from 2021 through 2025. If you're accessing this article on a site that republishes our RSS news feed, you may need to click through to our site to see the chart, which we created using Datawrapper.
This format is nice for seeing the various menu items ranked from year to year, but it isn't great for seeing what trends there may be in the cost for each item from year to year. To better visualize that data, we turned to Microsoft Excel to develop a clustered column chart.

Most items show a surge from 2021 to 2022, coinciding with the high inflation unleashed by former President Biden's policies after March 2021. After 2022 however, most items have either shown flat trends or have even declined by small amounts, with some notable exceptions.
The most notable exceptions involve either beef or dairy products, which is to say they are cow-related [1]. These costs have been rising because of the decline of U.S. cattle and dairy herds because of drought conditions, where cattle ranchers and dairy farmers have had to make hard choices to reduce the number of cows they raise because of the drought's impact on pastureland and shortages of feed, which has inflated the costs to raise both beef and dairy cattle.
Getting back to the Farm Bureau's analysis of 2025's cost of a summer cookout, they conclude:
After years of sharp food inflation, prices for many Fourth of July staples are finally beginning to level out. While some prices, particularly for proteins, will continue to be volatile due to disease pressures and labor costs, others are stabilizing thanks to improving supply chains and easing input prices.
Which is nice after four years of Bidenflation. In the case of beef and dairy products, we anticipate these costs will remain elevated for at least another 2-4 more years given the time it takes to raise new generations of cows to rebuild herds.
[1] We've been waiting years to use that really bad statistical pun.
Image credit: Group of people cooking on a grill outside photo by Mike Kilcoyne on Unsplash

The day after Thanksgiving is a difficult one because you now have to figure out what to do with all those leftovers from the big meal. Not all of them will be as good on their second serving. The turkey will be drier. Any vegetables or potatoes you cooked will be at risk of being overcooked when you heat them up again. Dishes that involve words like "casserole" are almost certainly best disposed of because they were bad ideas to begin with.
There is one exception. There's always room for pie.
Smart planning for Thanksgiving means preparing more than one pie to ensure that you can have enough pie to survive to the day after. While pumpkin pie is the traditional pie for Thanksgiving dinner, having another kind of pie on hand is the bonus you deserve for having enough restraint on Thanksgiving to ensure you can have more pie.
What other kind of pie do you want to have?
Sabrina Elfarra curated data from Google Trends in 2023 to find out what other kinds of pies Americans were looking up recipes to cook in the days leading up to Thanksgiving that year. Here's her map illustrating what she found to be the most popular Thanksgiving pie recipe search by state:

The alternate (non-pumpkin) pie recipes include:
- Apple
- Blackberry
- Cherry
- Coconut
- Grape
- Banana Cream
- Banoffee
- Buttermilk
- Butterscotch
- Cream
- Key Lime
- Chocolate
- Mississippi Mud
- Peanut Butter
- Pecan
- Frito Chili
- Sweet Potato
- Tamale
- Shoofly
If you're looking for non-pumpkin pie options, you might consider these for their second pie potential at next year's Thanksgiving holiday. Choose wisely!
Image credit: Different types of pies on a dining table by grabadonut on Wikimedia Commons. Creative Commons Creative Commons 4 - CC BY-SA 4.0.
Labels: data visualization, food, thanksgiving

It's Thanksgiving week! We're marking the occasion by taking on questions that may come up during family celebrations of the holiday. And while many of these questions might be asked by children, they're important enough that the U.S. Department of Agriculture's National Agricultural Statistics Service and the U.S. Fish and Wildlife Service keeps track of them.
Let's start with a very basic question: How many turkeys are there in the United States?
The answer to that question comes in two parts, because there are two distinct portions of the population of turkeys in the U.S. There are farm-raised turkeys, which are mainly raised in 13 states, and there are wild turkeys, who live throughout most of the continental U.S.
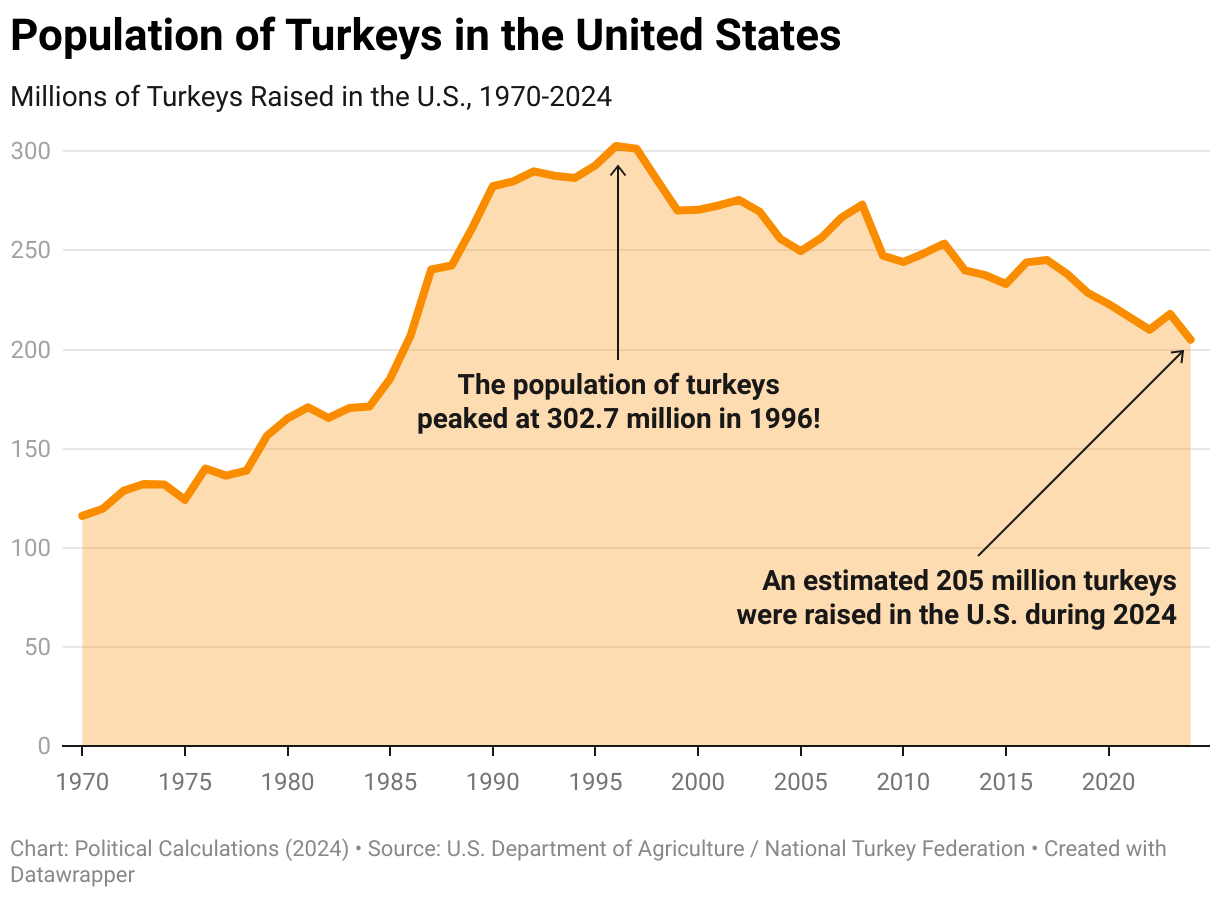
We'll start with the population of farm-raised turkeys, because their numbers are so much larger than the population of wild turkeys. In 2024, an estimates 205 million turkeys have been raised on U.S. farms. That number is down from 2023's estimated 219 million farm-raised turkeys and is well below the record number of 302.7 million turkeys that were raised on U.S. farms in 1996.
The following interactive chart presents the number of farm-raised turkeys for each year from 1970 through 2024:
It's harder to count the population of wild turkeys in the U.S. because their numbers have to be inferred from data collected by hunters and conservationists, where for every wild turkey they see, there are many more they did not see. The U.S. Fish and Wildlife Service reports there are an estimated 6.5 million wild turkeys in the U.S.
That puts the total population of turkeys in the U.S. at 211.5 million in 2024. Since about 97% of these turkeys were raised on farms, those birds are the ones you'll most often find at the center of a traditional Thanksgiving dinner.
References
U.S. Department of Agriculture National Agricultural Statistics Service. Livestock Historic Data. [Online Database: Survey - Animals & Products - Poultry - Turkeys - Production - Turkeys Production Measured in Head - Total - National - US Total - 1929-2024 - Annual - Year]. Accessed 14 November 2024.
Susan Morse. U.S. Fish and Wildlife Service. Wild Facts About Turkeys. [Online article]. Accessed 24 November 2024.
Image credit: Turkeys being raised on a turkey farm by Scott Bauer for the U.S. Department of Agriculture (3 February 2013) on Flickr. Creative Commons CC by-SA 2.0 Attribution-Sharealike 2.0 Generic Deed.
Labels: food, thanksgiving, turkey

Through August 2024, the cost of eating out at establishments that provide full service meals and snacks has risen 23% since January 2021.
In fact, when you go out to a restaurant today, it's not uncommon to see things like $16 dollar BLT sandwiches on the menu. How is it possible that two slices of toasted bread, a couple strips of bacon, several leaves of lettuce, and one or two tomato slices and some mayonnaise possibly cost so much?
The short answer is because of the inflation unleashed in early 2021. That inflation has driven up the costs of everything it takes to provide you as a customer with a BLT sandwich, including rents, utilities, and labor - it's not just the cost of food itself that has gone up.
Brian Will is a restaurant owner in the north Atlanta metropolitan area. In the following TikTok video, he lays out the percentages and costs of doing business that dictate why he has to charge for a BLT sandwich:
@dropoutmm Restaurant food is expensive #restaurantlife #foodcost #restaurantindustry #restaurant #businessowner #businesscoach ♬ original sound - The Dropout Multimillionaire
We thought the numbers he provided, including the average number of BLT sandwiches that his restaurant must sell per day just to break even, made for some interesting math. We've built the following tool to convert the numbers he throws out into the math behind them, but you're more than welcome to change the numbers to consider a multitude of other scenarios. If you're accessing this article on a site that republishes our RSS news feed, you may need to click through to our site to access a working version.
The default values are mostly those given by Will for his restaurant, which almost certainly involve some rounding. We tweaked the value of the unit cost of the food to roughly match what it would take for the restaurant to break even, assuming an average of 257 BLT sandwiches at $16 each per day. Of course, the restaurant's net income represents the income that Will and his partners earn through their ownership and management of the business. If they're just breaking even, with a net income of $0, they can't afford to be in business and the restaurant will shut down.
If they do have a positive net income, say from selling an average of 300 BLT sandwiches per day instead of just 257 to break even, they're going to have to pay income taxes on it, which is why we added that additional element to the tool.
There's one other aspect to consider as well. Today's inflated prices for BLT sandwiches and every other menu item on American restaurant menus are changing the way people eat, with fewer people willing to eat out because of the higher prices they would have to pay. The effect of inflation on supply and demand has a negative effect on the restaurant industry. If they could count on selling more sandwiches every day, they could sell them for a lower price, but the higher costs for everything that goes into making a sandwich to be served at a restaurant have made that marketing strategy much more risky.
If the risk of making the wrong decision in this real world scenario means going out of business, especially if you expect inflation to continue making everything more costly, could you as a business owner even afford to try?
Image credit: Photo by David Trinks on Unsplash.
Labels: business, food, inflation, investing, personal finance, tool

The American Farm Bureau Federation has shopped at grocery stores across the United States and found out how much a summer cookout will cost in 2024. they report their "volunteer shoppers had their most expensive Fourth of July grocery bill in the history of the survey this year."
But how costly is that? In 2024, they found the cost of the twelve items on the Farm Bureau's summer cookout menu totaled $71.22. That total is five percent higher than last year and is 30% higher than the cost of the same grocery store items purchased for a summer cookout five years ago.
Most of that increase has taken place since 2021, when the cost of a summer cookout was 20% lower than it is in 2024. In the following interactive chart, we show how much each individual menu item from the Farm Bureau's summer cookout menu cost in each year from 2021 through 2024. If you're accessing this article on a site that republishes our RSS news feed, you may need to click through to our site to see the chart, which we built using Datawrapper.
Only two of the twelve menu items in 2024 are less expensive than they were a year earlier: chicken and potato salad. Of the other ten items, the cost of pork chops and ground beef rose the most year over year.
Here's more information about how the Farm Bureau collects its cost data:
Volunteers from across the United States contributed to this year’s American Farm Bureau Fourth of July market basket survey to determine the average cost of summer cookout staples. The survey pulls prices for a complete, homemade cookout consisting of cheeseburgers, chicken breasts, pork chops, potato chips, pork and beans, fresh strawberries, homemade potato salad, fresh-squeezed lemonade, chocolate chip cookies and ice cream. With plenty of options to feed a hungry crowd, a group of 10 this year can expect to pay $71.22 for their celebration, up 5% from last year and up 30% from five years ago. Nationally, this means we are surpassing $7 per person for the first time, with the total meal coming to $7.12 a person. Only two dishes decreased in price while everything else on your table rose, on average. Your grocery bill may be a shock, but it is in line with the inflation that has roiled the economy – including the farm economy – over the last several years.
The Farm Bureau also indicates that after adjusting for inflation, 2022 was worse than 2024, which ranks second after that cost adjustment.
Image credit: Carne y Pollo #cookout by Brendan C. on Flickr. Creative Commons: CC by 2.0 Attribution 2.0 Generic Deed.
Labels: data visualization, food, inflation, personal finance

In 2016, the City of Philadelphia imposed its infamous soda tax. Starting in January 2017, the city has collected 1.5 cents on every ounce of non-alcoholic carbonated beverages distributed for retail sale within Philadelphia's city limits. When it passed the Philadelphia Beverage Tax (PBT), as it's officially known, city officials were counting on it delivering $92.4 million per year to the city treasury.
The Philadelphia Beverage Tax has always fallen short of that target. Before we show you how much it has been falling short, let's look at the city's recorded revenue from the PBT for each month from January 2017 through December 2023.
We've identified three main periods in the following chart. The period prior to the coronavirus pandemic lockdowns, which ran from January 2017 through February 2020. The period during which the state of Pennsylvania mandated two separate lockdowns of state residents, which together ran from March 2020 through March 2021. The third period is the post-lockdown period, which runs from April 2020 through December 2023.
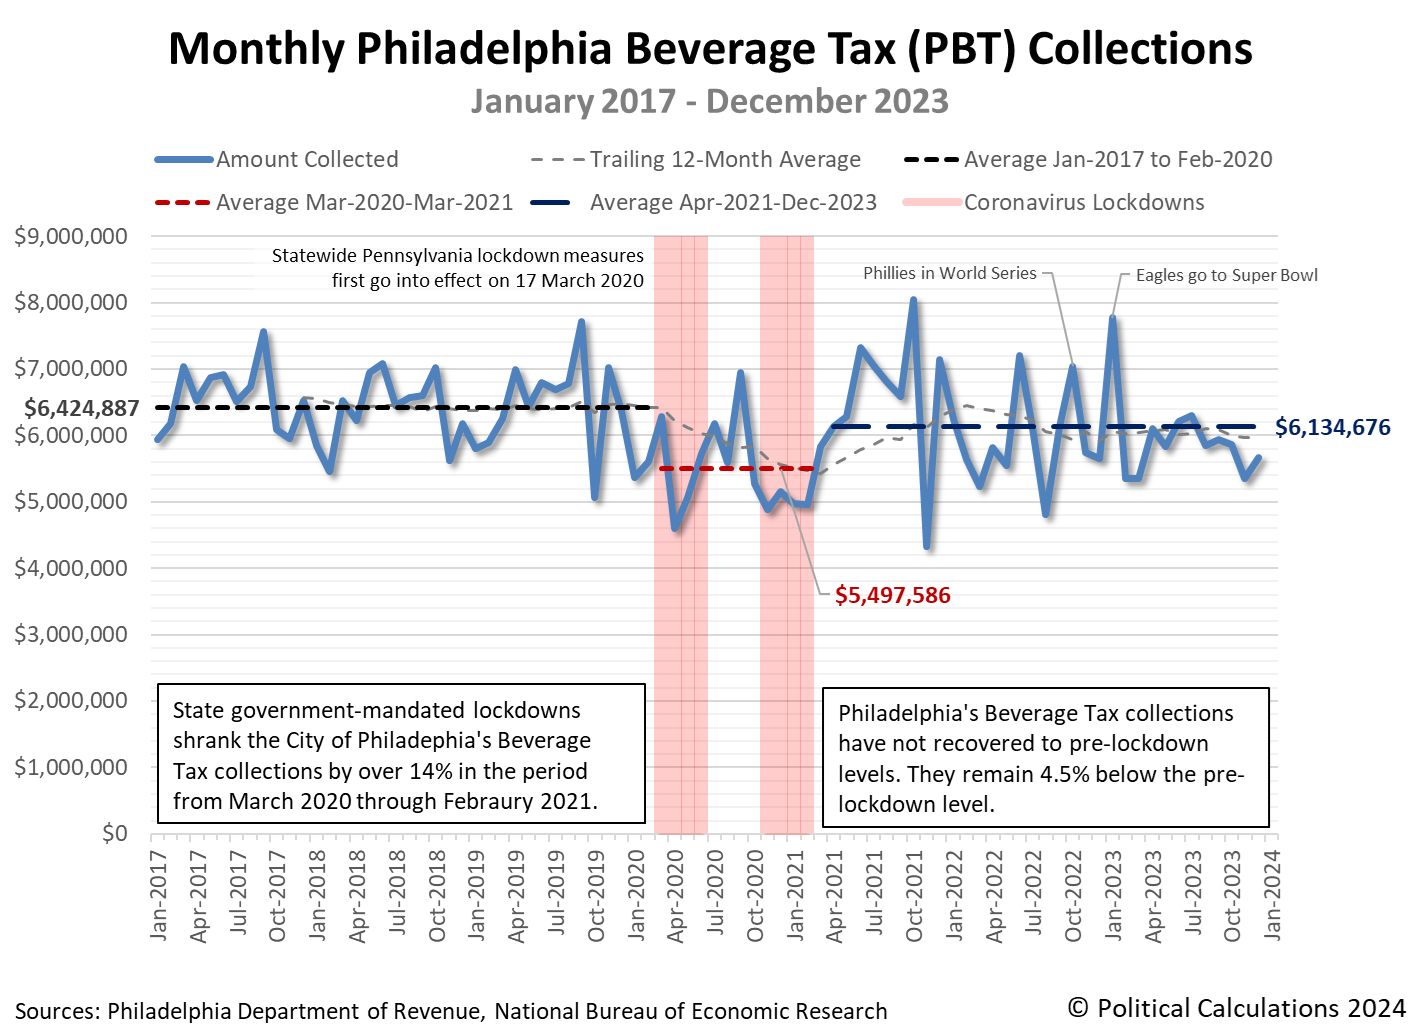
In the pre-lockdown period, Philadelphia collected an average of $6.42 million per month from the PBT. During the lockdowns, that monthly average dropped to about $5.50 million. After the lockdowns were lifted, the city has collected an average of $6.13 million per month.
Now, let's add up the monthly data to get the full calendar year tax collections data. We've done that in the next chart, where we find that Philadelphia's soda tax collections aren't just falling chronically short, the amount by which they are falling short has grown larger.
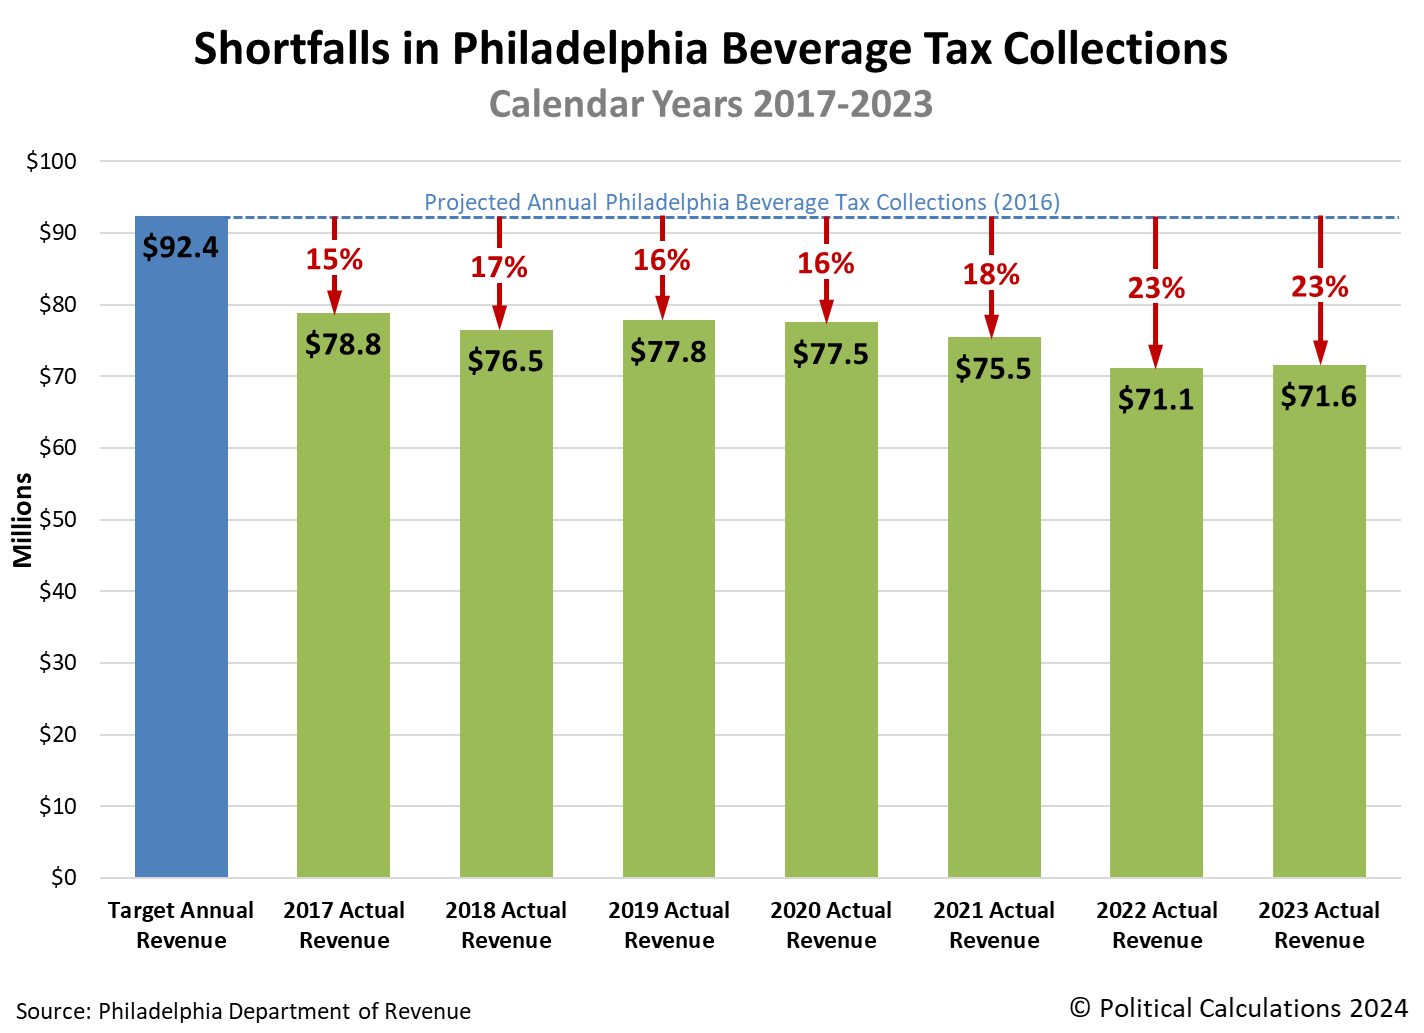
From 2017 through 2020, we see the Philadelphia's soda tax collections ranged between $76.5 million and $78.8 million, which represent shortfalls of 15-17% with respect to the city's original target. But those shortfalls have increased in the period since the lockdowns were lifted. The city's annual revenues from its soda tax have dropped below $72 million in 2022 and 2023, which is 23% below the amount they originally thought they were going to collect each year from it.
These chronic and growing shortfalls mean city officials aren't getting anywhere close to the money they counted on to fund "free" pre-K preschool services for Philadelphia residents and to pay for improvements to city schools, parks, and other facilities, all of which have fallen short of the promises made by city officials.
Reference
City of Philadelphia. Department of Revenue. City Monthly Revenue Collections. [Online Database]. Accessed 5 May 2024.
Image credit: Photo by Charlie Wollborg on Unsplash.

Inflationary price increases have resumed for Campbell's Tomato Soup.
Our monthly survey of the prices at which ten major grocery retailers are selling an iconic Number 1 size can of Campbell's Condensed Tomato Soup indicates upward price movement has resumed after stabilizing during the latter half of 2023.
The changes we're observing are significant for U.S. consumers because Campbell Soup (NYSE: CPB) has produced and sold its condensed tomato soup product in this standard 10.75 fluid ounce can continuously since January 1898. Because of that inherent characteristic, its price is not affected by the marketing trick of shrinkflation, in which producers try to hold their shelf prices steady for consumers in the face of sustained inflation by reducing the quantity of goods contained within their packaging. Its price cannot hide the corrosive effects of inflation within the economy.
Here are the prices we're observing in our mid-April 2024 survey along with how they have changed since our January 2024 report:
- Walmart: $1.26/each, unchanged
- Amazon: $1.26/each, decrease of $0.73 (-36.7%)
- Kroger: $1.39/each, increase of $0.10 (+7.8%)
- Walgreens: $1.99/each, unchanged
- Target: $1.39/each, unchanged
- CVS: $2.49/each, increase of $0.60 (+31.7%)
- Albertsons: $1.69/each, increase of $0.20 (+13.4%)
- Food Lion: $1.25/each, unchanged
- H-E-B: $1.31/each, unchanged
- Meijer: $1.29/each, unchanged
We think the most significant price change is the shelf price increase at Kroger-affiliated grocers. The Kroger (NYSE: KRO) family of grocery stores is the largest chain for this category of retailers in the United States. By comparison, Walmart (NYSE: WMT) is a larger retailer, but sells far more categories of consumer goods than just groceries. Together, these two companies sell more cans of tomato soup than many of the other grocers combined.
That includes Amazon, which is the only grocery-selling retailer to decrease their price in this report and which sells far fewer cans of soup than either Walmart or Kroger. Amazon is unusual among our surveyed grocery sellers in having very volatile pricing for Campbell's Condensed Tomato Soup, showing large swings in price from month to month. Our main takeaway in the online retailer's price for a single picnic-size can of Campbell's second-biggest selling soup product is that its April 2024 unit price is not less than $1.26, which is close to the floor among all our surveyed stores.
The following chart tracks the changing price of a 10.75 ounce can of Campbell's Condensed Tomato Soup from January 2000 through April 2024. (See this article for a chart visualizing our full price history from January 1898 through January 2024).
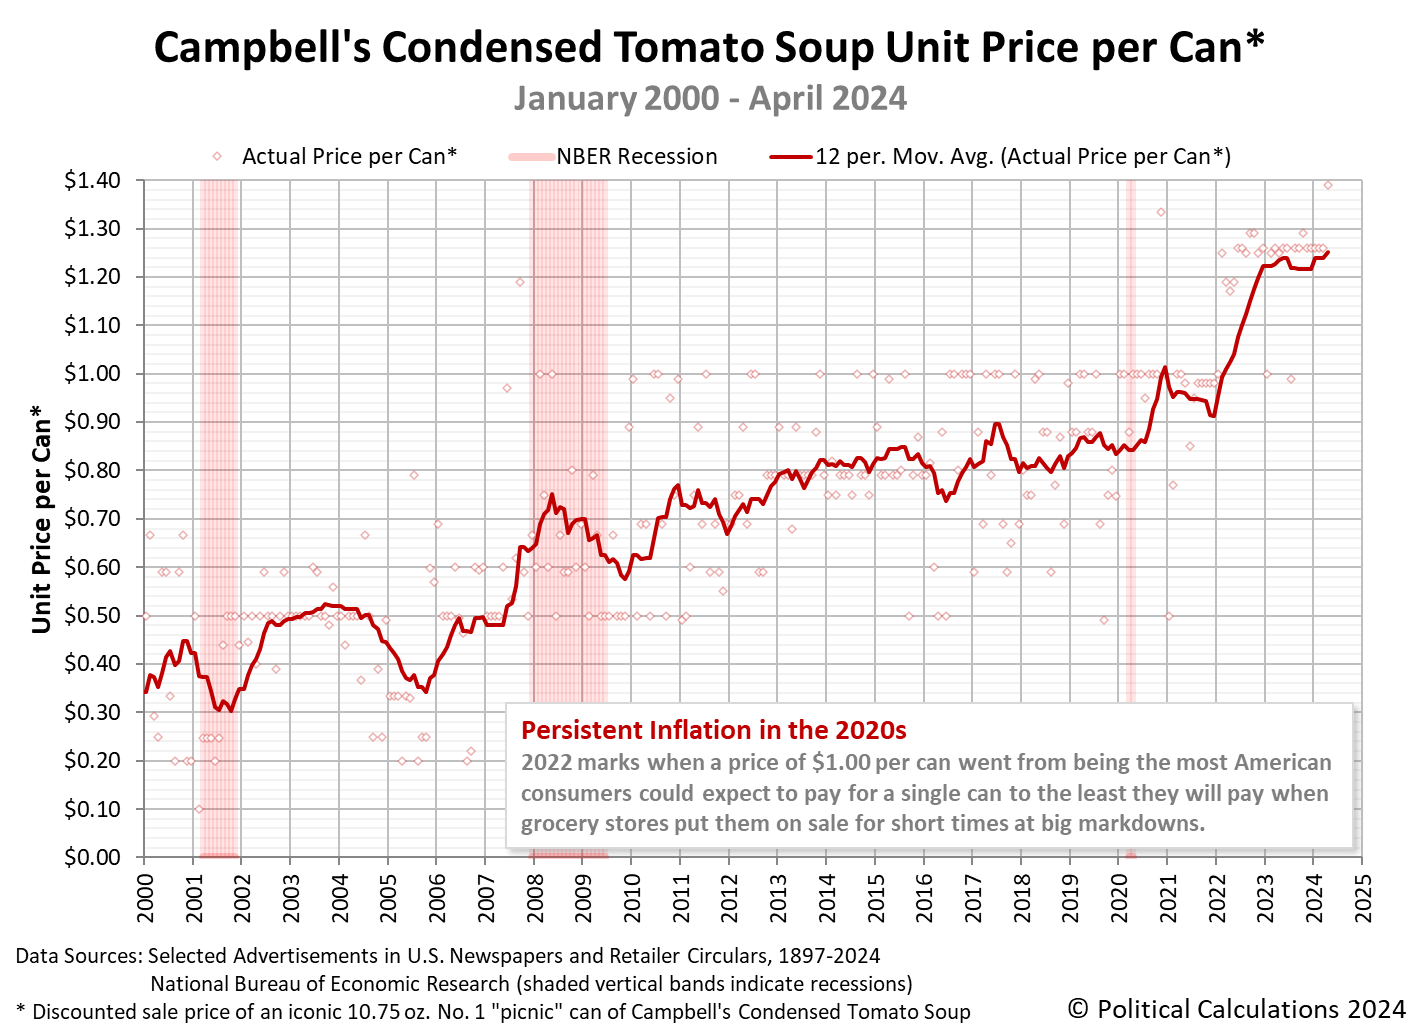
The trailing twelve month average price of a single can of Campbell's Condensed Tomato Soup is $1.25 in April 2024. This figure is 30% higher than what it was in March 2021 and is consistent with how overall food prices have changed in the U.S. economy in the period since the current era of elevated inflation began.
Image Credit: Microsoft Copilot Designer. Prompt: "A can of Campbell's Condensed Tomato Soup".

Ever since the National Biscuit Company launched what would become its most famous and popular product in 1912, materials scientists had been consumed by a "burning" question. Is it possible to twist the halves of an Oreo cookie so that its rich creme filling shears in half and sticks to each delicious chocolate wafer of the sandwich cookie when it is pulled apart?
It took eleven decades, but a team of MIT scientists finally cracked the problem wide open in 2022. They discovered the answer to that question is no, it is not possible. They discovered that because the creme filling of an Oreo sandwich cookie is "mushy", it is "very difficult to get it to stick to both sides when you twist one apart."
Or as MIT's Crystal Owens describes it, "what actually happens is the creme almost always comes of one side."
What made this incredible scientific discovery possible was the scientists invention of a device that could reliably apply a twisting force evenly on the halves of an Oreo cookie to measure how much torsion was applied before it split apart. Their specialized, unpatented innovation is called "The Oreometer". The following short video illustrates both what it is and how it works:
The device is intriguing in part because it doesn't require any electricity or utilize any electronic gages to either operate or measure the amount of torque applied to the Oreo cookie being twisted apart.
Because of their use of this invention in their research, the MIT researchers identified why the creme filling of an Oreo doesn't shear in half when the cookie is twisted, but instead tends to stick to just one of the chocolate wafers that make up the sandwich cookie.
Through a series of experiments with a laboratory rheometer used to hold whole Oreo cookies, we determined that creme distribution upon cookie separation by torsional rotation is not a function of rate of rotation, creme “stuf” (i.e., filling height H) level, or flavor, but was mostly determined by the preexisting level of adhesion between the cookie creme and each wafer. In most cases, creme delaminated from the wafer with a preferential orientation with respect to the package within any one box, allowing prediction of failure direction with 80% accuracy. Despite the consistent failure mode, there was some amount of cookie-to-cookie and box-to-box variation in failure stress and strain. Apparent reflow of creme due to unknown causes had the most significant effect in altering failure type, allowing for improved creme–wafer bonds and subsequent cohesive failure of the creme, splitting nearly evenly between the two wafers. Failure mechanics further allowed us to classify the creme texture as “mushy.”
In less scientific language, the mushy creme filling is less likely to stick to the chocolate wafer being twisted than it is to either split or shear within itself because of the applied torque. This characteristic is why twisting an Oreo sandwich cookie most often results in most of the creme filling remaining attached to one of the chocolate wafers but not the other when they are twisted apart.
That, as they say in science, is a result! Not to mention a finding made possible by a special purpose invention developed to support the rheologists' research.
From the Inventions in Everything Archives
Amazingly, the IIE team has previous featured another Oreo-related innovation, one also designed to perform a very specific task in which the parts of the sandwich cookie are separated from each other:
References
Crystal E. Owens, Max R. Fan, A. Johhn Hart, and Gareth H. McKinley. On Oreology, the fracture and flow of "milk's favorite cookie". Physics of Fluids 34, 043107 (2022). DOI: 10.1063/5.0085362.
Image credit: Photo by Suveer Bhat on Unsplash.
Labels: food, technology
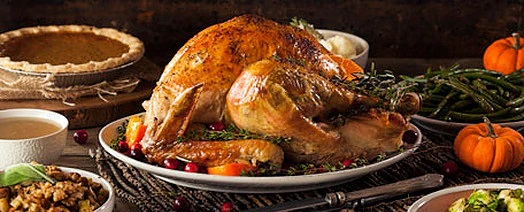
The American Farm Bureau Federation reports the cost of providing a traditional Thanksgiving turkey dinner for 10 people in 2023 is 4.5% lower than it was in 2022. The identical grocery items that cost $64.05 a year ago now cost $61.17 according to the Farm Bureau's annual shopping survey.
But as you'll see in the following chart, the cost of that traditional Thanksgiving dinner is still well elevated above what it was in 2020.

There's a lot of information in the chart showing how prices for the ten items of the AFBF's Thanksgiving dinner shopping list has changed in each year since 2020. We've used clustered columns along its horizontal axis to indicate the annual average price paid for each of the individual items, which are ranked according to their 2021 cost. We've also presented a cumulative cost curve for each year to show how each item adds to the total meal cost that is arrived at on the right-hand side of the chart.
Presenting the data this way lets us see that the increase in the cost of turkey is once again responsible for most of the year-over-year change in the cost of the meal. Here we see the cost of a 16-pound bird declined by 5.6% to $27.35 in 2023. That decline is attributable to the rebound from the negative impact of 2022's avian influenza epidemic on the supply on turkeys during 2022.
Unlike 2022, when only the price of cranberries fell from what they cost the previous year, 2023 saw a larger number of price declines among the items on the AFBF's shopping list. In addition to turkey, the prices for milk, cranberries, pie shells, cubed stuffing, whipping cream, and green peas were lower than their 2022 prices. Altogether, these items saw their prices collectively fall by $3.18.
Meanwhile, the prices of the 1-pound veggie tray, rolls, sweet potatoes, and pumpkin pie mix rose by a combined $0.30. The total net change is a reduction of $2.88, of which the $1.61 decline in the price of a 16-pound turkey is the biggest component, accounting for 56% of the year-over-year difference.
From 2011 through 2020, the cost of a traditional Thanksgiving dinner held steady within a relatively narrow range between $46.90 (2020) and $50.11 (2015). The cost of a traditional Thanksgiving dinner for 10 people remains 30% higher than 2020's level thanks largely to President Biden's inflation.
References
American Farm Bureau Federation. Farm Bureau: Survey Shows Thanksgiving Dinner Cost Up 14%. [Online Article]. 18 November 2021.
American Farm Bureau Federation. Thanksgiving Dinner Cost Survey: 2022 Year to Year Prices. [PDF Document]. 17 November 2022.
American Farm Bureau Federation. Thanksgiving Dinner Cost Relief, But Still High Relative to Recent Years. [Online Article]. 15 November 2023.
Image Credit: Thanksgiving Dinner. Public domain image by U.S. Department of Health and Human Services via U.S. Census Bureau.
Labels: food, inflation, personal finance, thanksgiving

In 2022, American poultry farmers were in crisis.
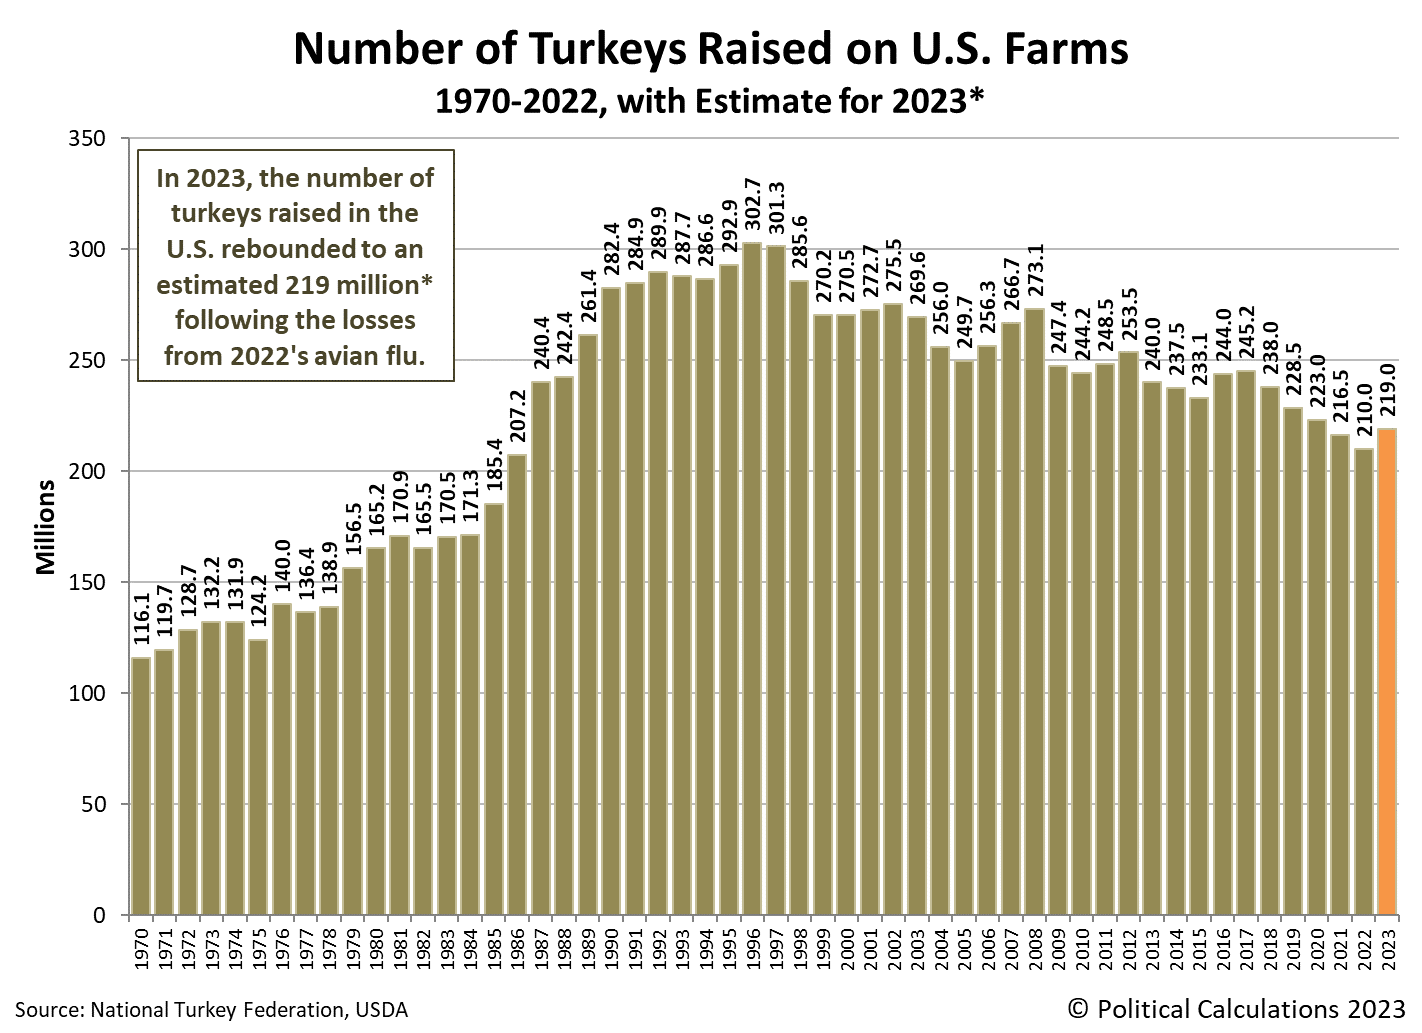
Thanks to outbreaks of Highly Pathogenic Avian Influenza (HPAI), entire flocks of chickens and turkeys on U.S. farms had to be culled to limit the spread of the highly infectious and deadly virus in early 2022. Before its spread abated, HPAI claimed the lives of approximately 36 million chickens, turkeys, and other game birds raised on U.S. farms. Among U.S. turkey producers, the population of turkeys plummeted from 216.5 million in 2021 to 210 million in 2022.
But in 2023, the domesticated turkey population rebounded to an estimated 219 million. That puts the number of turkeys raised in the United States back up the the level it was between 2020 and 2021.
That's also the third-lowest figure recorded since 1987, when the low-fat diet craze of the 1980s prompted a surge of demand for turkey among American consumers. It is also generally in line with the downward trend that has been in place since 1996, when the population of farm-raised turkeys peaked at 302.7 million.
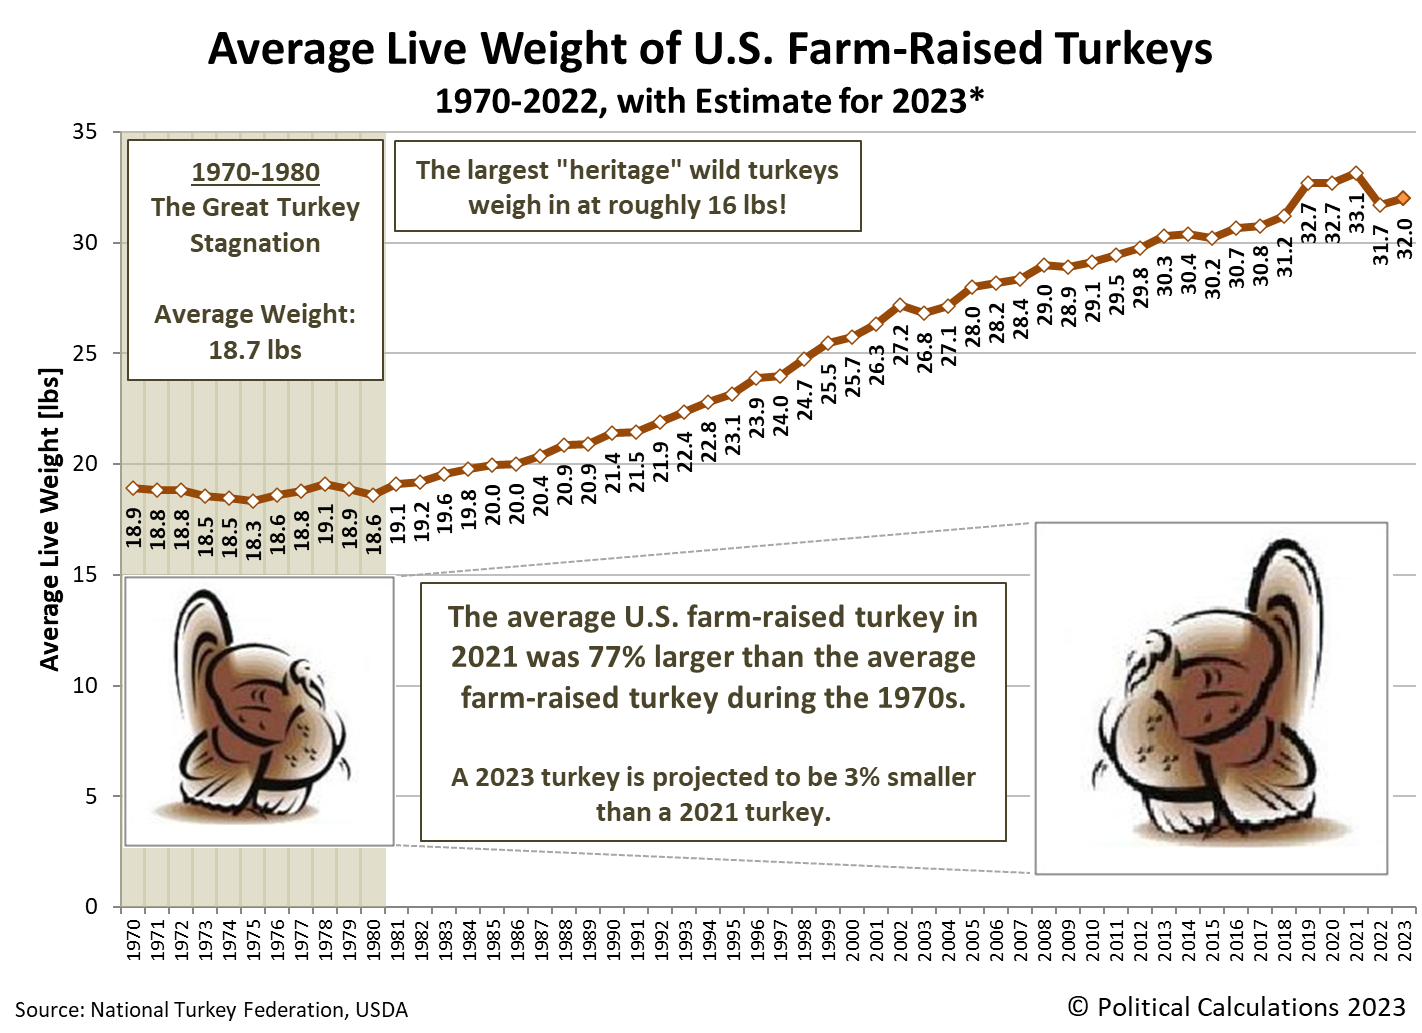
The U.S. Department of Agriculture estimates the average weight of a live turkeys being raised on U.S. farms in 2023 is 32.0 pounds (14.5 kg). That figure is up from the 31.7 pounds (14.4 kg) recorded in 2022, but falls a little over three percent below the record average live weight of 33.1 pounds (15.0 kg) set in 2021.
Assuming that average live weight estimate holds, the combined live weight of all turkeys raised in the U.S. during 2023 will total a little over 7 billion pounds (3.175 billion kg). That 5.3% increase from 2022's figure would be the fourth lowest annual total of the period since 1996, when U.S. turkey production first exceeded the 7.0 billion pound threshold.

The American Farm Bureau Federation puts the price of a 16-pound (7.26 kg) ready-to-cook turkey at $27.35 in 2023, which is down 5.6% from 2022's cost of $28.96. That figure however is over 41% more expensive than the $19.39 American consumers paid for the same size turkey in 2020.
Stay tuned for our next entry, when we'll look at the changing cost of a traditional Thanksgiving dinner since 2020.
References
U.S. Department of Agriculture. Turkeys Raised. [PDF Document]. 27 September 2023.
U.S. Department of Agriculture. Meat statistics tables, recent. Table 3 - Livestock and poultry live and dressed weights. [Excel Spreadsheet]. 27 October 2023.
U.S. Department of Agriculture. Poultry - Production and Value. 2022 Summary. [PDF Document]. April 2023.
U.S. Department of Agriculture. World Agricultural Supply and Demand Estimates (WASDE - 642). U.S. Quarterly Animal Product Production. Nov Proj. Turkey (Ready To Cook Weight, millions of pounds). [PDF Document]. 9 November 2023.
Image credit: Microsoft Bing Image Creator. Prompt: "farm turkeys, photograph, highly detailed, photorealistic, 4k, digital art concept".
Labels: food, thanksgiving, turkey

Since our last snapshot of Campbell's tomato soup prices three months ago, we're seeing continued signs that its price to American consumers is stabilizing.
That's the good news. The bad news is the average unit price at which it is stabilizing is over 28% higher than its cost three years ago. In October 2020, the trailing twelve month average price of an iconic Number 1 size can of Campbell's Condensed Tomato Soup was $0.95 per 10.75 fluid ounce can. In October 2023, that measure has increased to $1.22. The only reason it hasn't risen higher is because we've captured some short-term discounted sale pricing in our regular sampling of prices in recent months. Discounted sale pricing that isn't sustained, confirming higher prices are here to stay.
Here's what we found when we sampled prices for Campbell's condensed tomato soup in mid-October 2023 at ten major national or regional grocers and compared them to our sampling from July 2023. There's bad news if you shop for tomato soup at the second-largest drug store retailer in the United States.
- Walmart: $1.26/each, unchanged
- Amazon: $1.26/each, unchanged
- Kroger: $1.29/each, increase of $0.30 (+30.3%)
- Walgreens: $1.99/each, a decrease of $0.30 (-13.1%) when you buy a single can, but an increase of $0.49/each (+32.7%) because you can no longer pay just $1.50/each when you buy two cans
- Target: $1.39/each, unchanged
- CVS: $2.09/each, increase of $0.20 (+10.6%), or unchanged at $1.50/each when you buy two cans
- Albertsons: $1.69/each, increased $0.40 (+31.0%)
- Food Lion: $1.25/each, unchanged
- H-E-B: $1.31/each, unchanged
- Meijer: $1.29/each, unchanged
Here's what the overall trends for the average consumer price of Campbell's tomato soup looks like in the 21st century.

This chart visualizes a remarkable transition. In it, 2022 marks when the regular sale price of Campbell's Tomato Soup broke through the threshold of $1.00 per can. It is when the price of $1.00 per can went from being the most American consumers would ever expect to pay for a single 10.75 ounce can of Campbell's condensed tomato soup to almost the least they will pay when grocery stores put them on sale for short times at big markdowns. Without those very temporary discounts, the lowest regular sale price for Campbell's Tomato Soup we see at U.S. grocers is at $1.25-$1.26 per can.
For the latest in our coverage of Campbell's Tomato Soup prices, follow this link!
Our next update will come in January 2024, when we'll present an updated version of our chart tracking the unit price per can of Campbell's Condensed Tomato Soup since January 1897.
Previously on Political Calculations
Political Calculations' analysis of Campbell's Tomato Soup dates back to 2015! Along the way, we've filled in the gaps we had in the historic price data and have explored America's second-most popular soup from a lot of different angles.
- The Price of Campbell's Tomato Soup Since 1897 (2015)
- The Tomato Soup Standard (2015)
- The First Ad Ever for Campbell's Condensed Tomato Soup (2015)
- War and Soup (2015)
- Working Backwards from Retail to Cost (2015)
- Early Advertising Milestones for Campbell's Condensed Soups
- Updated: The Price of Campbell's Tomato Soup Since 1897 (2016)
- Everyday Low Prices (2017)
- Soup and Recession (2017)
- Soup and Steel Tariffs (2018)
- Tomato Soup, Oil and Inflation (2018)
- Celebrating 150 Years of the Campbell's Soup Company (2019)
- The Price History of Campbell's Tomato Soup (2020)
- Campbell's Tomato Soup Sales Soar as Americans prep for Home Quarantines (2020)
- Campbell's Soup Presents "The Magic Shelf" (2020)
- The Price of Campbell's Tomato Soup in the Coronavirus Pandemic (2021)
- The Pandemic Price Escalation of Campbell's Tomato Soup (2021)
- Shrinkflation and a New Tool to Track Price Inflation in Real Time (2021)
- Absence of Discounts Confirms Tomato Soup Inflation (2021)
- The Ship of Theseus and Campbell's Tomato Soup (2021)
- The S&P 500 and Campbell's Tomato Soup (2021)
- Upward Price Pressure at the Start of Soup Season (2021)
- Recent Price Trends for Campbell's Tomato Soup (2021)
- The Price History of Campbell's Tomato Soup (2022)
- Campbell's Tomato Soup Prices Explode Higher (2022)
- Major Grocers Continue Hiking Tomato Soup Prices (2022)
- Campbell's Tomato Soup Prices Keep Escalating (2022)
- Campbell's Soup to See Third Wave of Price Increases (2022)
- Amazon Hikes Campbell's Tomato Soup Prices (2022)
- Cost of Campbell's Tomato Soup Keeps Rising (2022)
- The Price History of Campbell's Tomato Soup (2023)
- Inflation Slows for Campbell's Tomato Soup (2023)
- Campbell's Tomato Soup Prices Stabilizing at Inflated Level (2023)
Image credit: Campbell's Condensed Tomato Soup Can on a Yellow Background photo by Anastasiya Badun on Unsplash.
Welcome to the blogosphere's toolchest! Here, unlike other blogs dedicated to analyzing current events, we create easy-to-use, simple tools to do the math related to them so you can get in on the action too! If you would like to learn more about these tools, or if you would like to contribute ideas to develop for this blog, please e-mail us at:
ironman at politicalcalculations
Thanks in advance!
Closing values for previous trading day.
This site is primarily powered by:

CSS Validation

RSS Site Feed

JavaScript
The tools on this site are built using JavaScript. If you would like to learn more, one of the best free resources on the web is available at W3Schools.com.
Other Cool Resources
Blog Roll


