Visual Capitalist's Gabriel Cohen and Miranda Smith have taken on the challenge of showing how the GDP of individual states in the U.S. compares with entire countries. That's a unique challenge because U.S. economic output is much larger than all other nations. Here's how Cohen describes it's relative size:
Overall, the U.S. has a $30.8 trillion national GDP, roughly equal to the combined output of China, Germany, and Japan, the world’s next three largest economies.
Matching national GDPs to state-level GDPs within the U.S. is also challenging because there's not a one nation-to-one state match. In their visualization, Cohen and Smith work around that by identifying the nearest national GDP that comes closest to a state's GDP. As a result, some nations show up more than once.
The following infographic presents their results using available GDP data for 2025, following an abstract version of how the U.S. is often presented on elementary school wall maps:

Cohen singles out the four biggest state economies for more discussion:
At $4.3 trillion, California would rank among the world’s five largest economies if it were an independent country. Its closest match on the map is the United Kingdom.
Texas, meanwhile, has a $2.9 trillion economy, putting it closest to Russia. Both are major energy powerhouses, particularly in oil and gas.
New York’s $2.5 trillion economy is roughly the same size as Canada’s GDP. Meanwhile, Florida’s $1.8 trillion economy is closest to Australia, the largest economy in Oceania.
Together, these four states would each qualify for the Group of 20 (G20) if they were independent countries.
There is another way to put the relative size of the U.S. economy into perspective with this visualization: counting up the nations they reference to approximate the total gross domestic product of the United States in 2025. Here's what we came up with in doing that count:
- (5) Taiwans
- (2) Belgiums
- (2) Finlands
- (2) Ukraines
- (1) Austria
- (1) Algeria
- (1) Australia
- (1) Bahrain
- (1) Canada
- (1) Costa Rica
- (1) Czechia
- (1) Denmark
- (1) Dominican Republic
- (1) Ethiopia
- (1) Ghana
- (1) Greece
- (1) Hungary
- (1) Iran
- (1) Kazakhstan
- (1) Kenya
- (1) Kuwait
- (1) Malaysia
- (1) Myanmar
- (1) Morocco
- (1) Norway
- (1) New Zealand
- (1) Peru
- (1) Poland
- (1) Portugal
- (1) Russia
- (1) United Arab Emirates
- (1) United Kingdom
- (1) Uruguay
- (1) Saudi Arabia
- (1) Singapore
- (1) Slovakia
- (1) Slovenia
- (1) Switzerland
- (1) Thailand
- (1) Turkmenistan
- (1) Vietnam
- (1) Zimbabwe
Reference
Gabriel Cohen and Miranda Smith. Mapped: Every U.S. States' Economy, Matched to a Country. Visual Capitalist. [Online Article and Image]. 16 August 2026.
Labels: data visualization, gdp


The U.S. economy received an upside surprise in the third and final estimate of GDP for the first quarter of 2026. In nominal (not adjusted for inflation) terms, the nation's GDP reached $31.866 trillion after growing by an annualized rate of 5.76% over the previous quarter. The actual year-over-year increase in nominal GDP is 6.07%.
That's $361.7 billion (or 1.1%) higher than had been forecast by the climbing limo GDP forecasting method nearly three quarters ago, which we anticipated would understate the economy's growth.
Reports indicate business investments in Artificial Intelligence (AI) technology are responsible for the outperformance:
The most striking feature of the Q1 data is not its size but its composition. Business investment jumped 10.6% in the first quarter, a sharp acceleration from the 2.4% recorded in Q4 2025. Nearly all of that increase was concentrated in information processing equipment — computers, servers, and the physical infrastructure powering the artificial intelligence buildout — along with software and research and development spending.
Analyst estimates based on BEA sub-component data suggest that AI-related investment contributed roughly three-quarters of the quarter’s total GDP growth. The information sector, federal government spending, professional and scientific services, and durable goods manufacturing were the leading industry contributors. Meanwhile, retail trade, wholesale trade, and finance and insurance all declined.
Looking forward, the climbing limo GDP forecasting method anticipates nominal GDP will continue rising in 2026-Q2, reaching around $32.75 trillion. The following chart shows how actual non-inflation adjusted GDP estimates are tracking with the model's previous projections:

This estimate assumes the momentum the U.S. economy recorded in growing between 2025-Q1 and 2025-Q3 will be sustained through the ending calendar quarter of 2026-Q2. Given the momentum of actual GDP and the impact of the Iran war geopolitical event that wasn't a factor influencing the projection of GDP at the time of the model's momentum-based forecast, we think the climbing limo's projection of nominal GDP in 2026-Q2 will overstated.
The most distant future projection we can make with available finalized GDP data is for 2026-Q4, where the climbing limo forecasting method anticipates the nation's nominal GDP will end the year around $33.05 trillion.
References
U.S. Bureau of Economic Analysis. National Income and Product Accounts. Table 1.1.5. Gross Domestic Product. [Online Database]. Accessed 25 June 2026.
Image Credit: Microsoft Copilot Designer. Prompt: "A chart showing a limousine driving up a bumpy GDP trajectory that rises over time".
Labels: gdp, gdp forecast
Going by Mars' calendar, the third quarter of Mars Year 38 (MY38) ended on Friday, 24 April 2026. Sadly, the Red Planet's nascent economy remained stalled with no new rock samples either drilled or stored for future export by the Mars Perseverance rover during the 146 (Earth) days of the quarter. Mars GDP' for the quarter is therefore $0.
The following video provides a very brief introduction to the work the Mars Perseverance rover has done that counts as Mars' only economic activity at its current phase of exploration.
At present, there is no feasible path for the export of the collected samples either stored on the rover or stored at a depot location on the Martian surface. Even the least costly proposals for a sample return mission were determined to be too expensive to execute with available technologies, resulting in the funding for continued development for it being cancelled in January 2026.
The following chart shows the economic activity generated by the Mars Perseverance rover since it has been on Mars, by Martian year and quarter:

The lack of a viable means to return the Perseverance samples doesn't mean those samples won't ever be collected and exported to Earth, but it underscores the failure in the original planning that left the sample return portion of the mission too poorly defined. The first missions that do return samples from Mars will almost certainly return the samples they collect using return launch capabilities they specifically transport with them.
For example, Japan's Space Agency plans to launch a probe to Mars' moon Phobos to collect and return a sample, building on the experience the gained from retrieving samples from asteroids. Meanwhile, fabrication has begun on China's probe that will return samples from the surface of Mars.
In other news, we may need to revisit our estimates of the value of the Mars' rock samples currently stocked in the Perseverance inventory and the "Three Forks" sample depot. An experiment conducted on the older Mars Curiosity rover on its drilled rock samples provided evidence of some very interesting organic chemistry:
NASA's Curiosity Mars rover has uncovered a diverse mix of organic molecules on Mars, including chemicals widely considered building blocks for the origin of life on Earth.
The findings, which come from a chemical experiment performed for the first time on another world, reveal that the Martian surface can preserve the kinds of molecules that could serve as signs of ancient life. However, this experiment cannot distinguish between organic compounds from potential past life on Mars and those formed through geologic processes or delivered by meteorites.
Definitively identifying signs of past life would require returning rock samples to Earth.
Here's the paper where the findings were reported on 21 April 2026.
Our Mars GDP estimates are based on the estimated value of the rock samples collected for export by the Mars Perseverance rover, which are in turn based on the value of Martian meteorites that have been found on Earth that have not had similar evidence of organic compounds. Samples that do have these compounds will be substantially more valuable. Should any of the Perseverance samples have such a chemical signature, we will likely need to revise our GDP estimates upward to capture their greater value.
What that value might be has yet to be determined.
Labels: gdp, ideas, technology
The United States' top export to China is soybeans.
However, with the U.S. and China engaged in a tariff war during most of 2025, soybean shipments plunged all the way to zero from June through October 2025. Following orders from the top of China's government, Chinese firms hadn't even bothered to place any orders to buy U.S. soybeans.
That changed on 30 October 2025. As part of the tariff war truce struck between the two nations, China's government negotiators agreed that Chinese state-controlled firms like Sinograin and COFCO would purchase 12 million metric tons of U.S. soybeans before the end of 2025. The agreement also specified China would buy 25 million metric tons of soybeans in each of the next three years.
China's purchases of 12 million metric tons worth of U.S. soybeans in 2025 was confirmed on 20 January 2026. But because China started placing orders so late, most of the crop they bought was nowhere close to where it could be quickly loaded on oceangoing ships to China. We suspect most of the soybeans bought by China in November and December 2025 were stored closer to where the crops are grown in the American Midwest. The following video shows how soybeans make their way to the Mississippi River, where they are loaded onto barges in the first stages of their export to other nations:
It takes time to transfer soybeans from siloes to trucks and then onto barges. It takes more time for the barges to sail down toward the port of New Orleans, where the soybeans are transferred from the barges to shipping containers and bulk cargo ships. It then takes even longer for the container-laden and bulk cargo ships to sail down to the Panama Canal and cross to the Pacific Ocean, where it then takes another few weeks to arrive at China's ports where they are unloaded.
In November 2025, the U.S. Census Bureau reports the U.S. exported just $21 million worth of soybeans to China. At that month's average spot price of $10.50 per bushel, that works out to be about 56,577 metric tons. In December 2025, the total value of soybeans exported from the U.S. to China jumped to $593.8 million, which at $10.40 per bushel, represents about 1.55 million metric tons of soybeans being shipped.
Altogether, U.S. export data has yet to account for roughly another 10.45 million metric tons of U.S. soybeans bought by China to be exported from the U.S. Assuming the same price of $10.40 per bushel as recorded for December 2025, that's about $4 billion worth of soybeans headed to China that hasn't yet been officially recorded in U.S. export data because it wasn't in place to depart from the U.S. before the end of the year.
As you can see in the following chart, the $593.8 million of soybean exports in December 2025 was enough to reverse a downtrend and start a small upward surge.

We anticipate that new surge will accelerate upward in January and February 2026 as the remaining 10.45 million metric tons of soybeans reaches their ports of exit and begins their long sea voyage to China. When it does, it will amp up U.S. GDP numbers for the first quarter of 2026, just as the absence of U.S. soybean exports in the fourth quarter of 2025 contributed to that quarter's lackluster recorded growth.
References
U.S. Census Bureau. U.S. International Trade in Goods and Services (FT900). U.S. Trade in Goods with China, Not Seasonally Adjusted, Nominal Figures, Total Census Basis. [Online database]. Accessed 19 February 2026.

The pace at which human carbon dioxide emissions are accumulating in the Earth's air held steady in April 2025. The trailing 12-month average of the year-over-year change in atmospheric CO₂ concentration was 3.29 parts per million.
That's a reduction of 0.28 parts per million, or about 7.9%, from the modern-era record of 3.57 parts per million recorded in December 2024. The change coincides with a sharp slowdown in China's economic output following boosted production aimed at beating expanded tariffs and trade restrictions on the nation's exports.
The slowdown is evident in atmospheric carbon dioxide concentration data because China is, by a very wide margin, the world's leading producer of carbon dioxide emissions. The following chart shows how this measure has changed from January 2000 through April 2025:

The slowdown is evident in atmospheric carbon dioxide concentration data because China is the world's leading producer of carbon dioxide emissions by a very wide margin.
The following tool gives an estimate of how much economic activity in worldwide (and predominantly in China) has declined since December 2024. If you're accessing this article on a site that republishes our RSS news feed, you may need to click through to our site to access a working version.
The tool's estimates are based on Jenny Cederborg's and Sara Snöbohm's 2016 paper. In their research, they investigated whether there is a relationship between economic growth and carbon dioxide emissions and identified a positive correlation between CO₂ emissions and GDP per capita. They found "CO₂ emissions increase by approximately 0.0002 [metric] tons (0.2 kg) per capita when GDP per capita increase by 1 dollar, holding all other variables constant".
That relationship doesn't take the effects of inflation into account, so the tool's results based upon it are likely understating the reduction in global GDP associated with the reduction in CO₂ emissions.
That said, global GDP for 2024 is estimated to be around $110 trillion, which means the indicated global GDP reduction of $9.3 trillion since December 2024, or about 8.5%, is substantial.
And to underscore the point, this figure represents a low estimate for GDP loss through March-April 2025 because of the effects of inflation recorded since 2016, which includes the period of high inflation unleashed by the Biden-Harris administration in early 2021.
References
National Oceanographic and Atmospheric Administration. Earth System Research Laboratory. Mauna Loa Observatory CO2 Data. [Online Data]. Updated 5 May 2025.
Cederborg, Jenny and Snöbohm, Sara. Is there a relationship between economic growth and carbon dioxide emissions? Semantic Scholar. [PDF Document]. 2016.
Image credit: Stable Diffusion DreamStudio Beta. Prompt: "Digital art concept of carbon dioxide emissions being used to measure economic growth."
Labels: environment, gdp, tool

"Mars... I can't believe I'm back on Mars."
If you're a fan of science fiction, you'll recognize the quote from the Babylon 5 character Michael Garibaldi. It's an inhospitable place. And yet, it's a place where economic activity has been occurring since the Earth Year 2021. Or if you prefer, since the first quarter of Mars Year 36, if we go by a bespoke calendar for the Red Planet determined by Earth astronomers.
We've developed an approach for estimating the value of Mars' Gross Domestic Product, which at this phase of the planet's economic development, consists of rock samples being collected by the Mars 2020 Perseverance Rover on the planet's surface.
Unlike previous science missions to Mars, what makes the collection of these samples qualify as economic activity is the intent to export them to Earth, as the samples are currently being deposited into inventory to support their export.
Those export plans have run into a snag as being too costly, with NASA laying off hundreds of employees at its Jet Propulsion Laboratory because of the cost of its export business plan. During 2024, NASA has been soliciting new ideas for how to make the Martian export economy a reality.
Assuming one or more of these new plans proves to be both viable and affordable, the following chart indicates our range of estimates of Mars' GDP by Martian year and quarter. This data differs from our previous estimates because we've modified the estimates align the dates of the storage dates of Perseverance's rock samples with the Martian calendar:

Should NASA's initiative to export Perseverance's inventoried rock samples be shelved, the Mars' GDP estimates will drop to zero.
Previously on Political Calculations
- Meanwhile, on Mars...
- The Birth of the Martian Economy
- Mars Recovers from First Recessionary Event
- Mars' GDP Triples in Martian 3Q
- The Annual GDP of Mars After One Martian Year
- Plans for Exports from Mars Go Back to the Drawing Board
Image Credit: NASA/JPL-Caltech/MSSS: Mars. Caltech's 84th Annual Seminar Day Looks into the Body and out to the Stars. [Photo]. 21 May 2021.
The rate at which carbon dioxide accumulates in the Earth's atmosphere has fallen back to levels that were typical at the beginning of 2008-2009's Great Recession.
You can see that development in the following chart tracking the trailing twelve month average of the year-over-year change recorded in measurements of atmospheric carbon dioxide at the remote Mauna Loa Observatory in the Pacific Ocean.
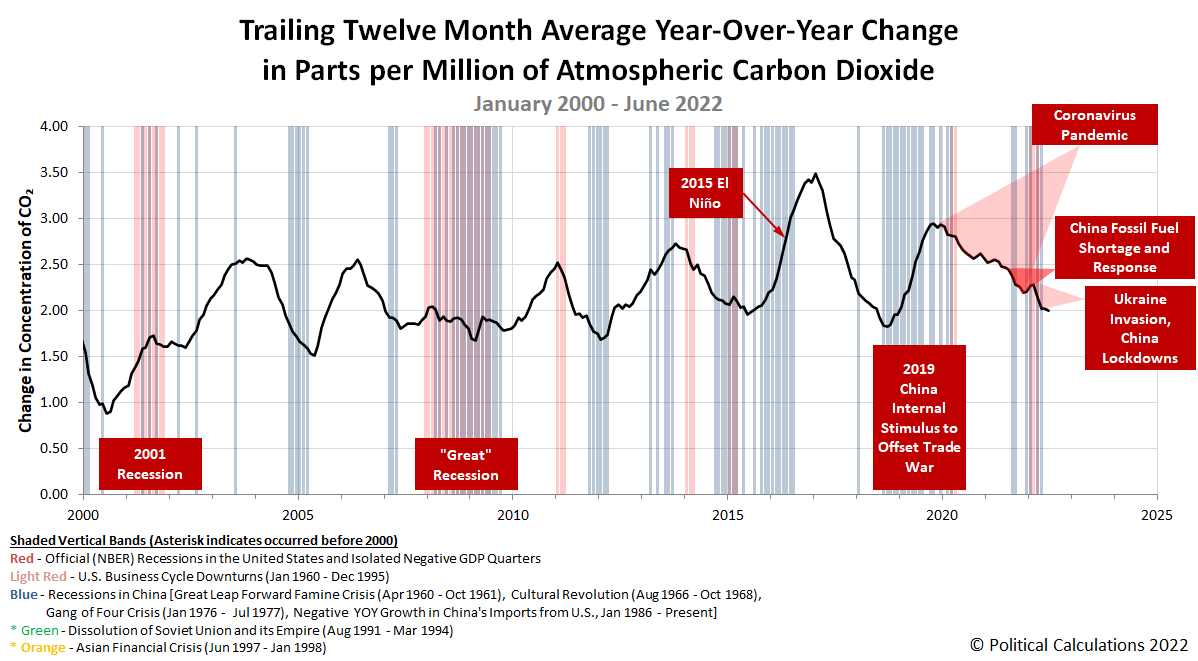
China's 2022 COVID lockdowns have played an outsize role in creating that outcome, with China's economy slumping in the second quarter of the year to its lowest level since 1991 because of them.
Turning back to the CO₂ data, June 2022's decline occurred despite China lifting most of its COVID lockdowns from the spring, allowing economic activity to resume within the country. That activity is confirmed by increases in roadway congestion and in goods moving through its ports.
We think that June 2022's decline may be explained by decreased economic activity elsewhere in the world. For example, there are strong indications the real U.S. economy shrank in the second quarter of 2022, which would offset positive GDP growth in China's economy during June 2022.
References
National Oceanographic and Atmospheric Administration. Earth System Research Laboratory. Mauna Loa Observatory CO2 Data. [Text File]. Updated 11 July 2022. Accessed 11 July 2022.
Labels: environment, gdp
On 7 December 2022, we documented the birth of the Martian economy and estimated the planet's GDP. Six Earth months and just over one Martian quarter later, we're ready to revisit the Red Planet to find how things have changed.
And change they have, because in between then and now, Mars' economy experienced its first recession-like event. After collecting its sixth cored rock sample on 29 December 2022 and putting it into inventory, the Perseverance rover ran into a technical problem that prevented it from collecting more samples, effectively suspending economic activity on the planet. Here's the story from NASA's press release:
On Wednesday, Dec. 29 (sol 306) Perseverance successfully cored and extracted a sample from a Mars rock. Data downlinked after the sampling indicates that coring of the rock the science team nicknamed Issole went smoothly. However, during the transfer of the bit that contains the sample into the rover’s bit carousel (which stores bits and passes tubes to the tube processing hardware inside the rover), our sensors indicated an anomaly. The rover did as it was designed to do - halting the caching procedure and calling home for further instructions.
NASA subsequently determined that rocky debris from its latest core sample blocked the rover's drilling equipment from seating properly, taking it out of action until it might be cleared. Here's a photo of the debris, which you can see at the bottom of the rover's drilling bit carousel:

It took almost a full Earth month to do it, but NASA's engineers succeeded in ejecting the debris from the bit carousel, allowing the rover to continue its rock core sample collecting mission. The rover would proceed to collect its seventh rock core sample on 8 March 2022 after traveling to its location in Mars' Jezero Crater. One week later, the rover collected its eighth sample that will someday be exported to Earth.
Since then, NASA engineers directed the Perseverance rover to travel to a new location in an ancient river delta within the crater to scout where it might collect additional rock samples. It has not collected more as of the end of the Martian quarter.
That brings us to the first revision of Mars GDP for its first quarter and the first estimate of its GDP in its second economic quarter.
We find our first estimate of Mars' quarterly GDP missed the collection of the fourth sample on 24 November 2021, so we need to adjust the estimate to account for it. We find Mars' GDP in its first economic quarter would fall in a range between $88,624 and $702,464. That range is up from the previously estimated range of $66,468 to $526,848.
Having added four samples to those original four in Mars' second quarter, we estimate the red planet's GDP will likewise fall between $88,624 and $702,464. With NASA engineers making a concerted effort to be more discriminating in selecting rock samples to core and store for future export to Earth, we think Mars' GDP will run to the higher end of that range.
We should also point out that had the debris issue not arisen and required a month to resolve, the Perseverance rover might have already collected its ninth rock sample. Martian GDP has fallen below its potential GDP for the first time.
If you're curious how Mars' future export economy will work, the following video explains what planetary scientists have in mind:
Back on Earth, NASA selected Lockheed Martin to develop the rockets that will be sent to Mars to collect the rock samples currently held in inventory by the Perseverance rover on the planet's surface on 7 February 2022.
Previously on Political Calculations
Postscript
Just because it's cool, here's video of a solar eclipse as seen from the surface of Mars involving its moon Phobos!
Truly fascinating. I zoomed in with my Mastcam-Z camera on a Phobos solar eclipse. This detailed video can help scientists on my team better understand the Martian moon’s orbit and how its gravity affects the interior of Mars, including its crust & mantle. https://t.co/jVdJ4UwhDx pic.twitter.com/q45HwKwLIS
— NASA's Perseverance Mars Rover (@NASAPersevere) April 20, 2022
Labels: economics, gdp, technology
The latest view from the volcano points to a higher level of economic gloom for the global economy.
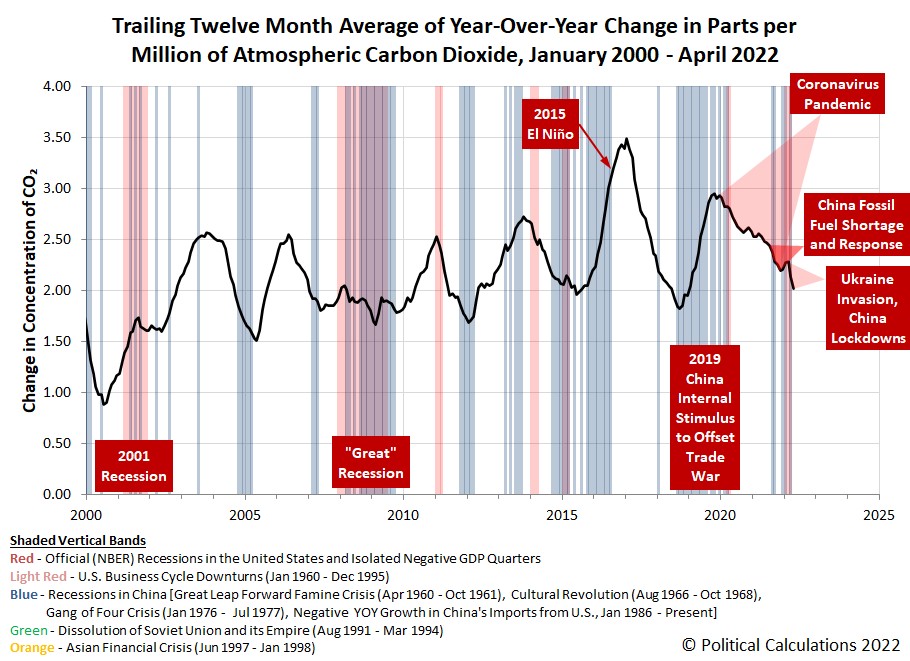
The explanation for that worsening situation is the same as last month: the expanding economic sanctions imposed against Russia following its invasion of Ukraine and, more significantly, China's government's continuing lockdown of Shanghai that threatens to expand to other areas of China.
We're seeing the effects of both situations show up at the remote Mauna Loa Observatory, located atop a volcano on the big island of Hawaii in the middle of the Pacific Ocean, which measures the concentration of carbon dioxide diffused in the Earth's atmosphere. The following chart reveals the sharp, steep decline in the pace at which carbon dioxide is being added to the Earth's atmosphere since February 2022.
The following tool may be used to convert the decline in the rate of CO₂ accumulation into an estimate of the net GDP loss in the global economy associated with it. If you're accessing this article on a site that republishes our RSS news feed, please click through to our site to access a working version of the tool.
Using the default value of a -0.27 parts per million to account for the change in the rate of growth of atmospheric carbon dioxide since February 2022, we find the equivalent net loss to global GDP attributable to the spread of COVID in southeast Asia and to China's fossil fuel shortage is $9.0 trillion. Going back to the beginning of the coronavirus pandemic in December 2019, the reduction of 0.92 part per million in the rate at which carbon dioxide is being added to the Earth's air corresponds to a net loss to global GDP of $30.6 trillion.
Analyst's Notes
We've updated the population data entry in the version of the tool presented above to reflect Earth's estimated 2021 population. Otherwise, the methodology behind the tool is unchanged from when we first introduced it in 2020.
Meanwhile, since we've forayed into planetary level economic analysis, we should note it has been five months since we developed the first-ever estimate of Mars' GDP. We're about a month away from the end of the latest Martian quarter and our next estimate of Mars' GDP, which is coming due because Martian quarters are roughly twice as long as business quarters on Earth.
References
National Oceanographic and Atmospheric Administration. Earth System Research Laboratory. Mauna Loa Observatory CO2 Data. [Text File]. Updated 5 May 2022. Accessed 5 May 2022.
U.S. Central Intelligence Agency. World Factbook. 1 July 2021 Population Estimate (World). [Online Article | Archived Document]. Accessed 8 May 2022.
Labels: environment, gdp, recession, tool
Going by the reduction in the rate at which carbon dioxide is accumulating in the Earth's atmosphere, November 2021 saw a net reduction in economic activity on the planet.
Since July 2021, much of that decline is associated with COVID-related disruptions of manufacturing production in southeast Asia, and also a shortage of fossil fuels that developed in China, which forced the Chinese government to shutter energy-intensive manufacturing. While both situations have somewhat abated, their disruptions still negatively affect the world's economy given the region's relatively "early" position in global supply chains.
A good example of that impact can be seen in the global market for new steel and aluminum production, where Chinese foundries provide the materials used within the country and elsewhere in the world for higher value production. China's production of steel and aluminum has fallen significantly in the last several months. That reduction has created shortages of materials for other countries like Germany, whose economic output has been greatly reduced as a result.
Here's a chart showing the continued decline in the rate at which human economic activities are adding carbon dioxide to the Earth's atmosphere.
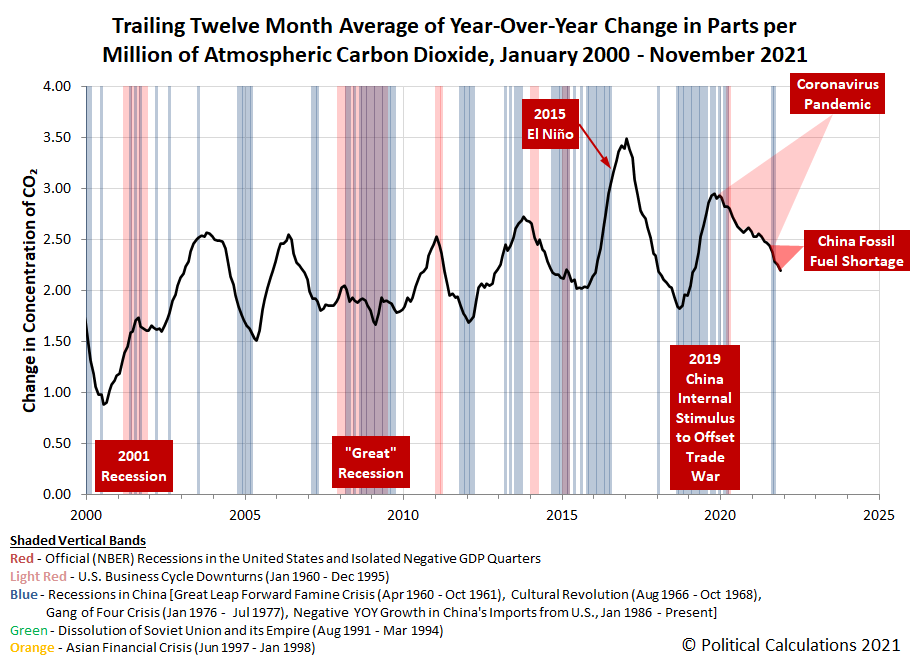
Since December 2019, a net reduction of 0.74 parts per million of atmospheric carbon dioxide has been recorded in the trailing twelve month average of the year over year rate of change in atmospheric carbon dioxide levels measured at the remote Mauna Loa Observatory. We estimate this change represents a net loss of $24.6 trillion to the world economy since the coronavirus pandemic originated in China at this time. Approximately a third of that decline has taken place since July 2021.
Meanwhile, on Mars, economic output has hit an all time high, but that's mainly because the red planet's GDP is now greater than zero. More on that story here from your sole source of planetary scale economic reporting!
References
National Oceanographic and Atmospheric Administration. Earth System Research Laboratory. Mauna Loa Observatory CO2 Data. [Text File]. Updated 6 December 2021. Accessed 6 December 2021.
Previously on Political Calculations
Here is our series quantifying the negative impact of the coronavirus pandemic on the Earth's economy, presented in reverse chronological order.
- Earth's Economy Continued Cooling in November 2021
- World GDP Shrinks at Slower Rate in October 2021
- Fossil Fuel Shortages Shrink World GDP
- Global GDP Falls as COVID Hits Southeast Asia
- World GDP Still Shrinking from Coronavirus Pandemic
- Estimated Net Global GDP Lost to Coronavirus Pandemic Exceeds $15.6 Trillion
- Coronavirus Pandemic Sends Global Economy Into Triple Dip Recession
- Double Dip Global Coronavirus Recession Sees Second Bottom
- Net Global GDP Lost to Coronavirus Pandemic Tops $13.6 Trillion
- Global Double Dip Coronavirus Recession Deepens
- Global Economy Enters Double Dip Coronavirus Recession
- Global Economy Teeters on Double Dip Recession
- World GDP Lost Due to Coronavirus Reaches $12 Trillion
- Cumulative World GDP Loss From Coronavirus Pandemic Tops $11 Trillion
- Estimates of World GDP Lost to the Global Coronavirus Recession
- Finding Human Fingerprints in Atmospheric CO2
- The Coronavirus and Atmospheric CO2 in April 2020
- The Coronavirus, Atmospheric CO2, and GDP
Labels: economics, environment, gdp
A little over three months ago, a momentous event passed with little notice. The economy of the planet Mars came into existence.
The occasion was marked in Nature, though neither the author of the report nor those directly involved in the achievement were fully aware of the significance of what they achieved on 6 September 2021. Here's the basic story of the accomplishment as they understood it:
After a failed attempt last month, NASA’s Perseverance rover has successfully drilled, extracted and stored a sample of Martian rock — the first ever Mars sample destined to be flown back to Earth for study.
“This is a momentous achievement,” said NASA administrator Bill Nelson in a statement.
When the rover first attempted the manoeuvre, on 6 August, the rock it was trying to sample crumbled into powder before making it into a sample tube. The second attempt, on 1 September at a different location several hundred metres away, went smoothly: the drill bit pulled a slim cylinder out of a 70-centimetre-long rock named Rochette. Engineers then paused the process so that they could photograph the core in its sample tube, to ensure it was intact, before sealing the specimen inside days later, on 6 September.
The core from Rochette now rests in Perseverance’s belly, hermetically sealed and ready to wait many years until future spacecraft can retrieve it and any other cores the rover manages to collect. The goal is to gather about 35 cores representing the geological history of Jezero Crater, Perseverance’s landing site — which was home to a river delta billions of years ago and might contain evidence of ancient Martian life.
Here's a short one-minute video documenting the Perseverance probe's drilling operation:
To be sure, this is not the first drilling operation on Mars, nor it the first time a rock sample has been moved or examined by an automated rover or lander on Mars. What makes this remote, robotically-performed operation different is what was done with the rock sample that was collected. It was put into inventory where it will remain stored until it might be exported from Mars.
These actions differentiate Perseverance's activity from all the missions to Mars that preceded it. That difference is meaningful in an economic sense, because it marks the first change ever recorded in the amount of inventory of a good produced for future interplanetary trade on Mars. We would argue this production along with the intent to transact or trade the produced good now being stored qualifies the production of the rock sample as a genuine economic activity. Without the intent to trade, the rover's work would not be meaningfully different from the activities of say a squirrel storing nuts or a roving herd of buffalo disturbing rocks while grazing on the prairie, which we don't think anyone would classify as economic events.
Let's put an economic value on the rover's economic activity. In this case, the cylindrical rock sample that is approximately 13-mm in diameter and 60-mm long, or rather, 7,964 cubic millimeters in volume. On 23 February 2021, Christie's auctioned a Martian meteorite sample measuring 91 mm x 79 mm x 2 mm (a volume of 14,378 cubic millimeters) for $40,000. Assuming the meteorite's material has a similar density, that would give an estimated value of Perseverance's first Martian rock sample of $22,156.
That's a low end estimate. Christie's also auctioned a smaller sample, measuring 26 mm x 12 mm x 2 mm (a volume of 624 cubic millimeters), for $13,760. If that price is more reflective of the value of the first rock core sample currently held in inventory on Mars, its value would be $175,616.
Since then, the Perseverance rover has collected two more samples. Therefore, based on what we know today, the first estimate of Mars' GDP can be found by multiplying the estimated value of one of its rock samples by three. The product of that math has a huge error band, likely falling somewhere between $66,468 and $526,848 during the current Martian quarter!
The real question though is this the right way to go about estimating GDP on a faraway planet with a robotic population? What really does qualify as economic production in this case? Do any non-human actions qualify as economic activity?
If you can answer these questions, well, the sky is no longer the limit, is it?
Celebrating Political Calculations' Anniversary
Our anniversary posts typically represent the biggest ideas and celebration of the original work we develop here each year. Here are our landmark posts from previous years:
- A Year's Worth of Tools (2005) - we celebrated our first anniversary by listing all the tools we created in our first year. There were just 48 back then. Today, there are over 300....
- The S&P 500 At Your Fingertips (2006) - the most popular tool we've ever created, allowing users to calculate the rate of return for investments in the S&P 500, both with and without the effects of inflation, and with and without the reinvestment of dividends, between any two months since January 1871.
- The Sun, In the Center (2007) - we identify the primary driver of stock prices and describe a whole new way to visualize where they're going (especially in periods of order!)
- Acceleration, Amplification and Shifting Time (2008) - we apply elements of chaos theory to describe and predict how stock prices will change, even in periods of disorder.
- The Trigger Point for Taxes (2009) - we work out both when, and by how much, U.S. politicians are likely to change the top U.S. income tax rate. Sadly, events in recent years have proven us right.
- The Zero Deficit Line (2010) - a whole new way to find out how much federal government spending Americans can really afford and how much Americans cannot really afford!
- Can Increasing the Minimum Wage Boost GDP? (2011) - using data for teens and young adults spanning 1994 and 2010, not only do we demonstrate that increasing the minimum wage fails to increase GDP, we demonstrate that it reduces employment and increases income inequality as well!
- The Discovery of the Unseen (2012) - we go where so-called experts on income inequality fear to tread and reveal that U.S. household income inequality has increased over time mostly because more Americans live alone!
We marked our 2013 anniversary in three parts, since we were telling a story too big to be told in a single blog post! Here they are:
- The Major Trends in U.S. Income Inequality Since 1947 (2013, Part 1) - we revisit the U.S. Census Bureau's income inequality data for American individuals, families and households to see what it really tells us.
- The Widows Peak (2013, Part 2) - we identify when the dramatic increase in the number of Americans living alone really occurred and identify which Americans found themselves in that situation.
- The Men Who Weren't There (2013, Part 3) - our final anniversary post installment explores the lasting impact of the men who died in the service of their country in World War 2 and the hole in society that they left behind, which was felt decades later as the dramatic increase in income inequality for U.S. families and households.
Resuming our list of anniversary posts....
- The Toolmaker's Tool (2014) - we make the code we use for creating online tools available to all!
- Replacing GDP with the National Dividend (2015) - we explore our development of an alternative measure of economic welfare that can replace GDP.
- The Gamblers Who Invented Modern Encryption (2016) - we discover that a group of gamblers seeking to break the law in Missouri back in 1905 put together many of the elements that underlie secure electronic communications and financial transactions in 2016!
- The Isolation of El Niño (2017) - in which we advanced the development of a global economic indicator for Earth!
- Telescoping Median Household Income Back in Time (2018) - we find a way to nearly double the available supply of monthly median household income estimates with reasonable accuracy.
- Cashing Out of the S&P 500 (2019) - we develop a tool to answer the question of whether you can survive being retired if you're counting on cashing out your investment in the S&P 500!
- The Deadly Intersection of Anti-Police Protests and COVID-19 (2020) - it was the year of the coronavirus and political protests, so we combined the two in a way that only we could.
- The Birth of the Martian Economy (2021) - we don't mess around when we say we celebrate big ideas, and what's bigger idea to celebrate than the birth of an entire planet's economy?
Labels: economics, gdp, ideas, technology
After COVID-19 disrupted the regional economy of Southeast Asia in July and August 2021, we're seeing a new factor behind recessionary forces affecting the Earth's GDP: fossil fuel shortages.
China has been coping with shortages of both coal and oil since August 2021, with now widespread power outages disrupting its economic output from September 2021 into October 2021. Since the country is the world's largest emitter of carbon dioxide by a very wide margin, the impact of its forced blackouts are already showing up in the measurements of atmospheric carbon dioxide concentration at the remote Mauna Loa Observatory in the Pacific Ocean.
The following chart shows that change as the steepening decline in the pace at which carbon dioxide is being added to the Earth's atmosphere since July 2021.

Since December 2019, a net reduction of 0.65 parts per million of atmospheric carbon dioxide has been recorded in the trailing twelve month average of the year over year rate of change in atmospheric carbon dioxide levels measured at the remote Mauna Loa Observatory. Since June 2021, a net reduction of 0.18 parts per million have been recorded. We can convert both these changes into an estimate of the lost GDP for the global economy using the following tool. If you're accessing this article on a site that republishes our RSS news feed, please click through to our site to access a working version of the tool.
Using the default value of a -0.18 parts per million to account for the change in the rate of growth of atmospheric carbon dioxide since June 2021, we find the equivalent net loss to global GDP attributable to the spread of COVID in southeast Asia and to China's fossil fuel shortage is $6.0 trillion. Going back to the beginning of the coronavirus pandemic, the reduction of 0.65 part per million in the rate at which carbon dioxide is being added to the Earth's air corresponds to a net loss to global GDP of $21.6 trillion.
Looking forward, the coal shortage has begun to affect India's economy, with reports of power outages in the country's northern states.
References
National Oceanographic and Atmospheric Administration. Earth System Research Laboratory. Mauna Loa Observatory CO2 Data. [Text File]. Updated 5 October 2021. Accessed 5 October 2021.
Previously on Political Calculations
Here is our series quantifying the negative impact of the coronavirus pandemic on the Earth's economy, presented in reverse chronological order.
- Fossil Fuel Shortages Shrink World GDP
- Global GDP Falls as COVID Hits Southeast Asia
- World GDP Still Shrinking from Coronavirus Pandemic
- Estimated Net Global GDP Lost to Coronavirus Pandemic Exceeds $15.6 Trillion
- Coronavirus Pandemic Sends Global Economy Into Triple Dip Recession
- Double Dip Global Coronavirus Recession Sees Second Bottom
- Net Global GDP Lost to Coronavirus Pandemic Tops $13.6 Trillion
- Global Double Dip Coronavirus Recession Deepens
- Global Economy Enters Double Dip Coronavirus Recession
- Global Economy Teeters on Double Dip Recession
- World GDP Lost Due to Coronavirus Reaches $12 Trillion
- Cumulative World GDP Loss From Coronavirus Pandemic Tops $11 Trillion
- Estimates of World GDP Lost to the Global Coronavirus Recession
- Finding Human Fingerprints in Atmospheric CO2
- The Coronavirus and Atmospheric CO2 in April 2020
- The Coronavirus, Atmospheric CO2, and GDP
Labels: environment, gdp, recession, tool
The triple dip global recession from the coronavirus pandemic continued deepening in July 2021.
Evidence supporting that conclusion is visible in the falling rate at which carbon dioxide is being added to the Earth's atmosphere. The trailing year average of that rate continued to fall in July 2021, as shown in the latest update to the chart tracking its history since January 1960.

Since December 2019, a net reduction of 0.49 parts per million of atmospheric carbon dioxide has been recorded in the trailing twelve month average of the year over year rate of change in atmospheric carbon dioxide levels measured at the remote Mauna Loa Observatory. We can convert that change into an estimate of the lost GDP for the global economy using the following tool. If you're accessing this article on a site that republishes our RSS news feed, please click through to our site to access a working version of the tool.
Using these default values, we estimate the net loss to global GDP since the SARS-CoV-2 coronavirus emerged in China and began impacting the world economy is closing in on $16.3 trillion.
References
National Oceanographic and Atmospheric Administration. Earth System Research Laboratory. Mauna Loa Observatory CO2 Data. [Text File]. Updated 5 August 2021. Accessed 5 August 2021.
Previously on Political Calculations
Here is our series quantifying the negative impact of the coronavirus pandemic on the Earth's economy, presented in reverse chronological order.
- World GDP Still Shrinking from Coronavirus Pandemic
- Estimated Net Global GDP Lost to Coronavirus Pandemic Exceeds $15.6 Trillion
- Coronavirus Pandemic Sends Global Economy Into Triple Dip Recession
- Double Dip Global Coronavirus Recession Sees Second Bottom
- Net Global GDP Lost to Coronavirus Pandemic Tops $13.6 Trillion
- Global Double Dip Coronavirus Recession Deepens
- Global Economy Enters Double Dip Coronavirus Recession
- Global Economy Teeters on Double Dip Recession
- World GDP Lost Due to Coronavirus Reaches $12 Trillion
- Cumulative World GDP Loss From Coronavirus Pandemic Tops $11 Trillion
- Estimates of World GDP Lost to the Global Coronavirus Recession
- Finding Human Fingerprints in Atmospheric CO2
- The Coronavirus and Atmospheric CO2 in April 2020
- The Coronavirus, Atmospheric CO2, and GDP
Labels: coronavirus, environment, gdp, tool
Welcome to the blogosphere's toolchest! Here, unlike other blogs dedicated to analyzing current events, we create easy-to-use, simple tools to do the math related to them so you can get in on the action too! If you would like to learn more about these tools, or if you would like to contribute ideas to develop for this blog, please e-mail us at:
ironman at politicalcalculations
Thanks in advance!
Closing values for previous trading day.
This site is primarily powered by:

CSS Validation

RSS Site Feed

JavaScript
The tools on this site are built using JavaScript. If you would like to learn more, one of the best free resources on the web is available at W3Schools.com.
Other Cool Resources
Blog Roll


