When it comes to the U.S. stock market, a geopolitical event like Russia’s invasion of Ukraine isn’t much more than an additional source of noise in the market.
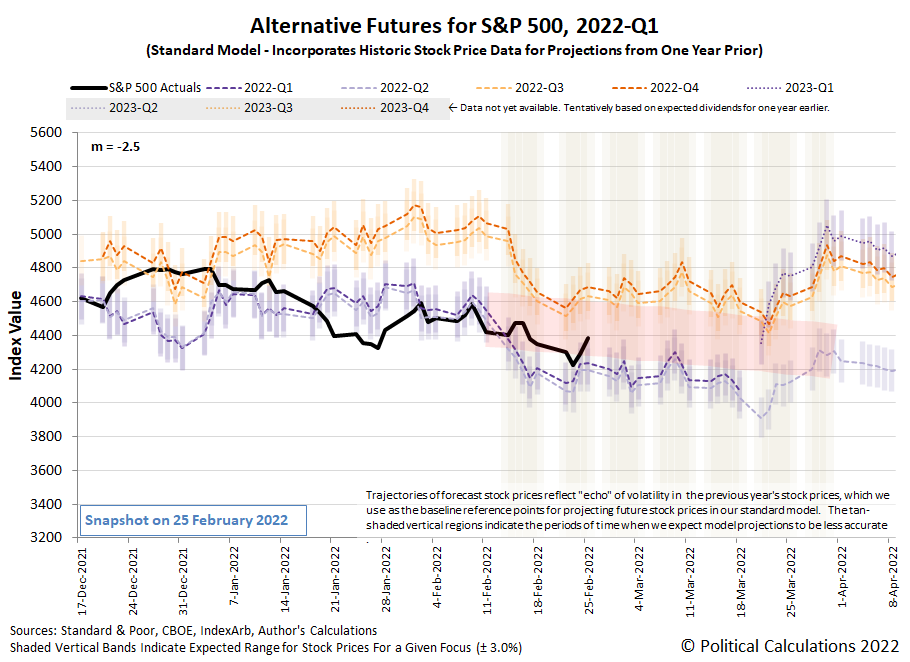
Evidence supporting that assessment can be seen in the latest update to the alternative futures spaghetti forecast chart for the S&P 500 (Index: SPX) . Here, we find that after dipping outside the redzone forecast range we set up several weeks ago as investors initially responded to the Ukraine crisis, that reaction was short lived as the trajectory of the index has since jumped back up toward the middle of the forecast range. Where we would expect it to be in the absence of Russia's invasion of Ukraine.
Using the middle of that forecast range as a counterfactual for how investors would have set the value of the index in the absence of that geopolitical event, we estimate that at the peak of its impact on Wednesday, 23 February 2022, the invasion reduced the value of the index by 5.1% at the market's close.
In terms of its 31 December 2021 market cap, a 5.1% decline represents about $2.2 trillion, so that's a very noticeable amount of noise for a geopolitical event, but it's still noise. By Friday, 25 February 2022, much of that additional noise had dissipated, with the S&P 500 rising to be within 1.3% of its predicted no-invasion level.
Is that an unusual lack of impact for something that has dominated the news cycle since it happened? Not really. This latest example aligns with Barry Ritholtz found when he studied eighty years worth of geopolitical events for how they affected the U.S. stock market. Here's the key takeaway from his analysis:
Most of the time, markets are hardly affected by these sorts of terrible events.
How much noise Russia's invasion of Ukraine ultimately generates will depend on how its risk environment evolves, as events from this past weekend demonstrate. We would describe it as a highly fluid situation presenting a lot of risk, both potential and realized, for investors.
While Russia's invasion of Ukraine was the biggest news item of the trading week that was, other stuff happened too. Here's our summary of market moving headlines from the President Day holiday-shortened trading week. Spoiler alert: the most important news shaping future expectations for U.S. stock market investors during the week came on Thursday, 24 February 2022 and had to do with the Fed's plans for hiking short term interest rates:
- Tuesday, 22 February 2022
- Signs and portents for the U.S. economy:
- Putin orders Russian forces to "perform peacekeeping functions" in eastern Ukraine's breakaway regions
- Ukraine war fears shake stocks and send oil soaring
- Full invasion of Ukraine? "Unlikely but who knows!"
- Explainer-How Western sanctions might target Russia
- Germany blocks opening of pipeline as West responds to Russian moves in Ukraine
- Oil hits highest since 2014 on Russia-Ukraine escalation
- U.S. business activity accelerates in February - IHS Markit survey
- U.S. consumer confidence slips, migration to the South fuels house price inflation
- Fed minions not sure if they will hike rates by 0.5% in March, plan to hike rates may be affected by Ukraine geopolitics:
- Fed's Bowman: too soon to tell if half percentage point rate hike needed in March
- Vladimir Putin muscles onto central banker agendas
- Three Fed banks voted to increase discount rate in January
- Bigger trouble developing in the Eurozone:
- After ECB shock, European firms confront higher borrowing costs
- German economy likely to shrink again in Q1: Bundesbank
- German producer prices soar as Bundesbank, BDI warn on economy
- Faster economic growth signs in the Eurozone:
- German economy grows at fastest rate for six months in February -PMI
- Euro zone recovery regained pace in Feb despite soaring prices -PMI
- Bigger stimulus developing in China:
- China plans bigger tax cuts in 2022 to prop up slowing growth
- Banks in nearly 90 Chinese cities cut mortgage rates
- S&P 500 confirms correction; Ukraine-Russia crisis keeps investors on edge
- Wednesday, 23 February 2022
- Signs and portents for the U.S. economy:
- U.S. mortgage applications tumble last week - MBA
- With fertilizer costs high and seeds scarce, U.S. farmers turn to soy
- Biden Reverses Nord Stream 2 Pipeline Waiver, Reverts To Trump's Sanction Policy
- Biden's "Milquetoast" Russia Sanctions Defanged After Berlin Says Nord Stream 2 Halt Not Permanent
- Explainer: Western sanctions on banks only scratch surface of Fortress Russia
- Oil steadies as U.S. seen unlikely to sanction Russian exports
- Fed minion says they want at least four rate hikes in 2022:
- NZ central bank hikes interest rates:
- ECB minions thinking about hiking rates to head off inflation:
- ECB could raise rates in summer before ending bond buys: Holzmann
- ECB has space to gradually normalize policy: Vasle
- ECB should keep steady hand in face of shocks
- ECB's de Guindos says asset purchases must end before raising rates
- Wall Street extends selloff on Ukraine worries
- Thursday, 24 February 2022
- Signs and portents for the U.S. economy:
- Oil surpasses $100, stocks slump, dollar rises as Russia invades Ukraine
- U.S. labor market recovery gaining steam; unemployment rolls smallest in 52 years
- U.S. new home sales fall in January as prices march higher
- Biden unveils sanctions on Russian businesses after Ukraine attack
- Fed minions working to set expectations of at least four rate hikes in 2022, Ukraine crisis may alter policy path:
- Fed's Bostic open to four or more hikes this year if high inflation persists
- Fed's Daly: balance sheet reduction should be gradual, predictable
- Ukraine crisis may slow, but not stop, Fed hiking
- ECB minions may use Ukraine crisis to justify continuing policy of keeping stimulus going:
- Nasdaq, S&P 500 gain, hit session highs after Biden comments on Russia
- Friday, 25 February 2022
- Signs and portents for the U.S. economy:
- U.S. companies grapple with surging costs as supply chain problems persist
- U.S. trade relationship with China "getting more difficult" - USTR
- U.S. consumer spending beats expectations; core capital goods orders surge
- Fed minions starting to worry about wage-price inflation spiral taking hold:
- Bigger trouble developing in Russia:
- Analysis-Russia's economic defences likely to crumble over time under sanctions onslaught
- French Finance Minister Le Maire: we want to isolate Russia financially
- Cutting Russia off SWIFT is "very last resort" -France's Le Maire
- Cutting Russia off SWIFT technically difficult - German govt spokesperson
- Explainer-Russian banks face exclusion as EU joins new round of sanctions
- Russian oil exports continue despite payment issues - sources
- India setting up role for itself in geopolitics:
- Exclusive-India plans urea import deal with Iran using rupee payments-sources
- India explores setting up rupee trade accounts with Russia to soften sanctions blow - sources
- Bigger stimlus developing in China:
- China to step up policy support for economy, Xinhua cites politburo
- China urges banks, insurers to support affordable rental housing
- BOJ minions to workshop policy for inflation, start trimming stimulus buys of corporate bonds:
- Japan's central bank plans experts' workshop to scrutinise inflation
- Japan's central bank lowers limits on CP, corporate bond purchases
- ECB minions told Ukraine crisis will shrink Eurozone economy:
- Dow posts biggest gain since Nov 2020 as Wall St rebounds second day
The onset of the Ukraine crisis had very little impact on investor expectations for future rate hikes. The CME Group's FedWatch Tool projects a total of six quarter point rate hikes in 2022, starting in March 2022 (2022-Q1), followed by additional hikes in May 2022 (2022-Q2), June 2022 (2022-Q2), July 2022 (2022-Q3), September 2022 (2022-Q3) and November (2022-Q4). That last rate hike represents the only change from the previous week, as investors had anticipated 2022's final rate hike would occur in December 2022.
Meanwhile, following the release of personal income and spending data, the Atlanta Fed's GDPNow tool reduced its projection of real GDP growth in 2022-Q1 down to 0.6%.
Have you ever really thought about odd numbers? Or what it is that makes them odd?
Vsauce's Michael Stevens has, sharing his thoughts in the following 22 minute video, which goes in directions you might not expect to explain why odd numbers mysteriously show up when gravitational acceleration is involved:
We're still on the fence as to whether the rules should prevent dogs from playing high school basketball, but the universe is an odd and mysterious place. Which is to say it's more entertaining when they can, once. We believe any potential sequels or reboots however should be strictly prohibited and are happy to cite the Beethoven franchise as proof.
Labels: math, none really
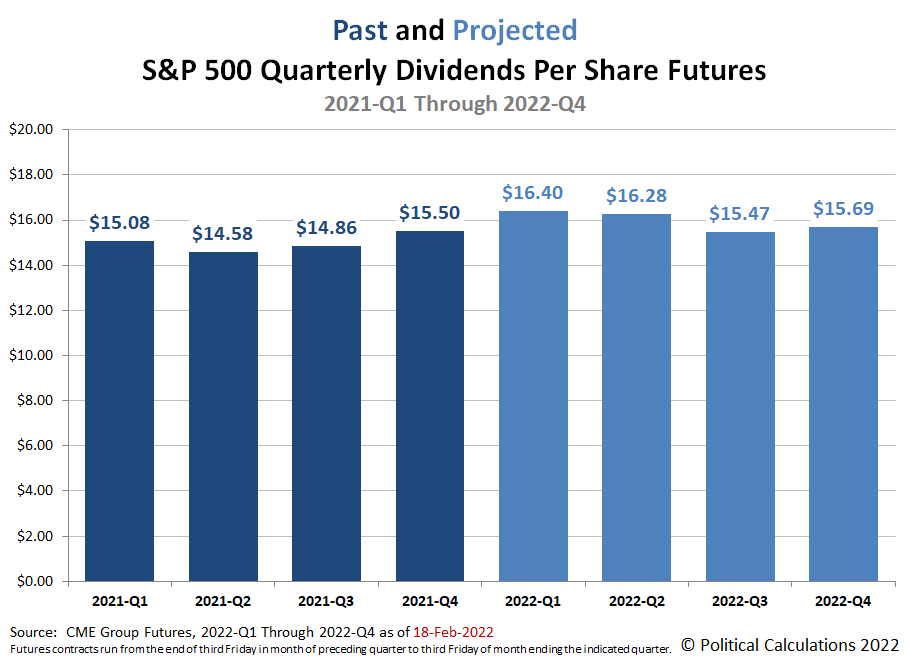
Having just looked at the expected earnings future for the S&P 500 (Index: SPX) at the midpoint of 2022-Q1, it's time to turn our attention to the more important expectations for the S&P 500's dividends per share. The following chart shows those expectations as of Friday, 18 February 2022:
Here's a quick summary of how these future expectations have changed for each quarter in 2022 since our last snapshot three months ago:
- 2022-Q1: Up $0.20 per share
- 2022-Q2: Up $0.74 per share
- 2022-Q3: Down $0.04 per share
- 2022-Q4: Up $0.18 per share
These changes reflect a generally improving outlook for S&P 500 dividends over the past three months, though we should caution that the underlying dividend futures data has been uncharacteristically volatile in recent weeks.
More About the Numbers
Dividend futures indicate the amount of dividends per share to be paid out over the period covered by each quarters dividend futures contracts, which start on the day after the preceding quarter's dividend futures contracts expire and end on the third Friday of the month ending the indicated quarter. So for example, as determined by dividend futures contracts, the "current" quarter of 2022-Q1 began on Saturday, 18 December 2021 and will end on Friday, 18 March 2022.
That makes these figures different from the quarterly dividends per share figures reported by Standard and Poor, who reports the amount of dividends per share paid out during regular calendar quarters after the end of each quarter. This term mismatch accounts for the differences in dividends reported by both sources, with the biggest differences between the two typically seen in the first and fourth quarters of each year.
Reference
The past and projected data shown in this chart is from the CME Group's S&P 500 quarterly dividend index futures. The past data reflects the values reported by CME Group on the date the associated dividend futures contract expired, while the projected data reflects the values reported on 18 February 2022.
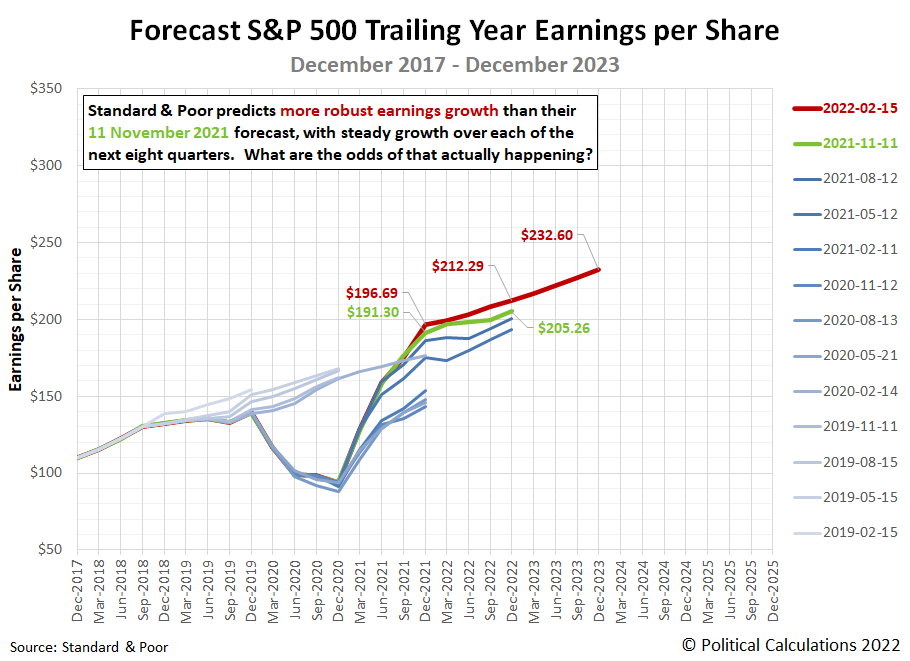
Every three months, we take a snapshot of the expectations for future earnings in the S&P 500 (Index: SPX) at approximately the midpoint of the current quarter, shortly after most U.S. firms have announced their previous quarter's earnings.
Since our last update three months ago, Standard and Poor modified their projections to indicate slightly stronger earnings growth through 2022 and steady earnings growth through the end of 2023.
2021 was highly unusual for its improving expectations for future earnings at each of our previous snapshots for the year. That improvement was possible because of the recovery from the coronavirus pandemic recession, which was largely dictated by the lifting of lockdown measures imposed by state and local governments. With most of those remaining measures soon to expire, that source of improvement for the business outlook of S&P 500 companies will evaporate in the first half of 2022.
Worse, it is being replaced by an economic environment in which the Federal Reserve will be raising interest rates to quelch excess inflation generated by the Biden-Harris administration's fiscal policies. Which is to say the latest earnings projections indicating steady earnings growth for the S&P 500 may be optimistic because the companies that compose the S&P 500 can expect new headwinds.
Reference
Silverblatt, Howard. Standard & Poor. S&P 500 Earnings and Estimates. [Excel Spreadsheet]. 15 February 2022. Accessed 18 February 2022.
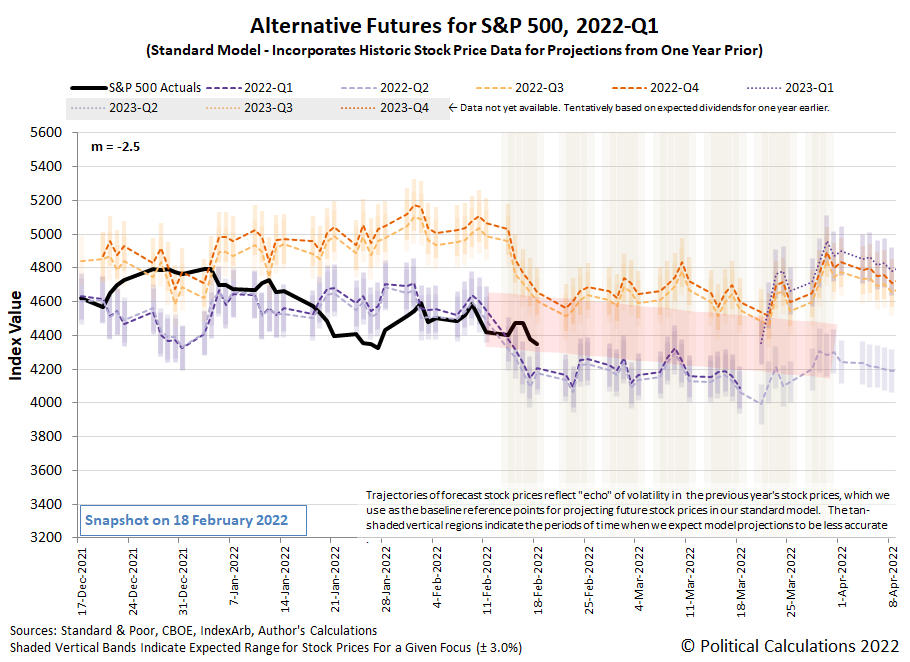
The S&P 500 (Index: SPX) continued following a volatile, downward trajectory in the trading week ending 18 February 2022. The latest update to the alternative futures chart reveals the index is falling within the projected range of the downward-pointing redzone forecast, which assumes investors are focusing on the near term future as they set current day stock prices.
The news of the past week confirms that attention, with investors paying close attention to both when and how the U.S. Federal Reserve will begin implementing rate hikes, with noise contributed by the Biden administration's disjointed attempt at geopolitics through its seemingly Zeno's paradox-based media strategy featuring claims of an imminent Russian invasion of Ukraine that would start on 16 February 2022, but didn't, only to be replaced by regularly updated claims of an ever-imminent Russian invasion. Which hadn't happened through the end of the trading week ending on Friday, 18 February 2022, but that was before the events of the long holiday weekend added more noise to the situation. Here is the market-moving news that did happen during the trading week that was:
- Monday, 14 February 2022
- Signs and portents for the U.S. economy:
- Record job-switching rates are pushing U.S. inflation higher, Chicago Fed study finds
- Oil hits 7-yr highs as Ukraine fears Russian attack imminent
- Fed minions worried they are losing credibility, not expected to do a sneak rate hike:
- Bullard: Fed "credibility is on the line" in inflation fight
- U.S. short-term rate futures pare back odds of Fed inter-meeting move
- ECB minions would rather go green than fight inflation:
- BOE minions dealing with inflation:
- UK employers plan biggest pay rises in nearly 10 years - CIPD
- BoE to raise rates again in March, inflation to peak soon after
- Japanese government minions want more inflation, BOJ minions happy to oblige:
- Japan govt spokesman voices hope BOJ will continue effort to hit inflation goal
- BOJ defends key bond yield target as global rates pressure builds
- The S&P 500 closes lower as Russia-Ukraine tensions heat up
- Tuesday, 15 February 2022
- Signs and portents for the U.S. economy:
- World Bank minion tells Fed minions what they should do, U.S. Treasury yield curve sends different message:
- World Bank chief says gradual rate hikes, bond 'tapering' unlikely to control inflation
- Analysis-U.S. yield curve prices for Fed tightening, shows fears of policy error
- Bigger stimulus developing in China:
- ECB minions expected to boost deposit rate to -0.25% by end of 2022:
- Wall Street surges as Russia-Ukraine tensions cool
- Wednesday, 16 February 2022
- Signs and portents for the U.S. economy:
- U.S. mortgage interest rates top 4% for first time since 2019
- U.S. retail sales rebound sharply in January
- U.S. manufacturing output rises moderately in January
- U.S. import prices rebound sharply in January
- Fed minions provide tea leaves for investors to decipher, looks like they'll make things up as they go:
- Fed minutes likely to provide details on rate hikes, balance sheet reduction
- Readout of January meeting shows Fed not wed to particular pace of rate hikes
- Fed's Kashkari: 'Let's not overdo it' on Fed rate hikes
- Slowing growth, inflation developing in China:
- ECB minions say scary inflation coming from inside the housing:
- Surging housing costs boosting overall euro zone inflation: ECB
- ECB warns about vulnerable property market in euro zone
- BOJ minions afraid of losing money unless it keeps stimulus going:
- BOJ may suffer losses in event it exits easy policy, says governor Kuroda
- BOJ's Kuroda says no plan to change long-term yield cap - for now
- The S&P 500 reverses losses, closes slightly higher after release of Fed minutes
- Thursday, 17 February 2022
- Signs and portents for the U.S. economy:
- Europe and Mideast crude premiums soar, with few options for buyers
- U.S. Senate aims for prompt passage of stop-gap bill to avert government shutdown
- U.S. labor market still tightening; freezing temperatures chill homebuilding
- Fed minion calls for bigger, faster rate hikes, start thinking about selling off mortgage bonds:
- Fed's Bullard repeats call for 1 percentage point in rate increases by July 1
- What could drive the Fed to a 'Plan B' for balance sheet reduction
- ECB minions like easy money policies, in no rush to end them as IMF approves:
- ECB's De Cos says withdrawal of stimulus scheme should be data-dependent, gradual
- ECB's Lane says no fixed size, frequency for rate hikes
- IMF backs ECB's easy policy as it sees inflation easing
- S&P 500 down 2% as Ukraine crisis sparks flight to safety
- Friday, 18 February 2022
- Signs and portents for the U.S. economy:
- Oil ends week mixed on geopolitical uncertainty, supply hopes
- U.S. leading economic indicator unexpectedly falls in January
- U.S. existing home sales accelerate; investors elbowing out first-time buyers
- Fed minions say they have policy wrong, but can still stick a 'soft landing' for U.S. economy even though economists don't believe them:
- Fed's Evans says policy "wrong-footed," but may not need to be restrictive
- NY Fed's Williams says central bank can manage soft landing for economy
- Fed's hopes for low inflation and lots of jobs may fall flat, economists say
- Bigger stimulus keeps rolling out in China:
- Chinese cities ease home purchase down-payments to reignite demand
- China issues new measures to spur COVID recovery for services sector
- China to boost commodity price supervision in push for industrial growth
- BOJ minions chill with inflation, ECB minions think about doing something about inflation later:
- Japan's inflation may exceed 1% but stay below BOJ goal, says central bank official
- Explainer-After defending its yield target, what's next for the BOJ?
- ECB's Kazimir calls for ending bond buying in August -Bloomberg
- Wall Street ends lower as investors eye Ukraine conflict
After trading closed on 18 February 2022, the CME Group's FedWatch Tool projects a total of six quarter point rate hikes in 2022, starting in March 2022 (2022-Q1), followed by quarter pint rate hikes in May 2022 (2022-Q2), June 2022 (2022-Q2), July 2022 (2022-Q3), September 2022 (2022-Q3) and December (2022-Q4). Meanwhile, the Atlanta Fed's GDPNow tool has boosted its real GDP growth to 1.3% for the current first quarter of 2022, up from last week's estimate of 0.7% real growth.
We're on the cusp of the Presidents Day holiday weekend in the U.S. While the nation's airwaves are once again full of advertisements for car and mattress sales, which is how American businesses have come to celebrate the event, the Inventions in Everything team is going to take a different route and celebrate the inventiveness of past U.S. Presidents.
As it happens, there's only one American President to whom a U.S. patent has ever been issued for something they invented. Abraham Lincoln was issued U.S. Patent 6,469 for his 1849 invention of a manner for Buoying Vessels Over Shoals. Here's the U.S. patent equivalent of Lincoln's later Gettysburg Address:
To all whom it may concern:
Be it known that I, Abraham Lincoln, of Springfield, in the County of Sangamon, in the State of Illinois, have invented a new and improved manner of combining adjustable buoyant air chambers with a steamboat or other vessel for the purpose of enabling their draght of water to be readily lessened to enable them to pass over bars, or through shallow water without discharging their cargoes; and I do hereby declare the following the be a full, clear, and exact description thereof, reference being had to the accompanying drawings making a part of this specification.
Here are the accompanying drawings:
Better still, there's a physical model of Lincoln's patented invention on display at the Smithsonian Institution's National Museum of American History:
In 2013, Charles Kuralt narrated a 48-minute video segment celebrating Lincoln's patented invention on CBS News' Sunday Morning broadcast. His slow-paced, anachronistic style works well in bringing the story of Lincoln's pre-Civil War era invention for an America that traveled by river to life, where we do recommend clicking through to view it.
From the Inventions in Everything Archives
There aren't any other inventions by those who became U.S. Presidents, but the IIE team has previously covered the following seaworthy inventions:
Labels: technology
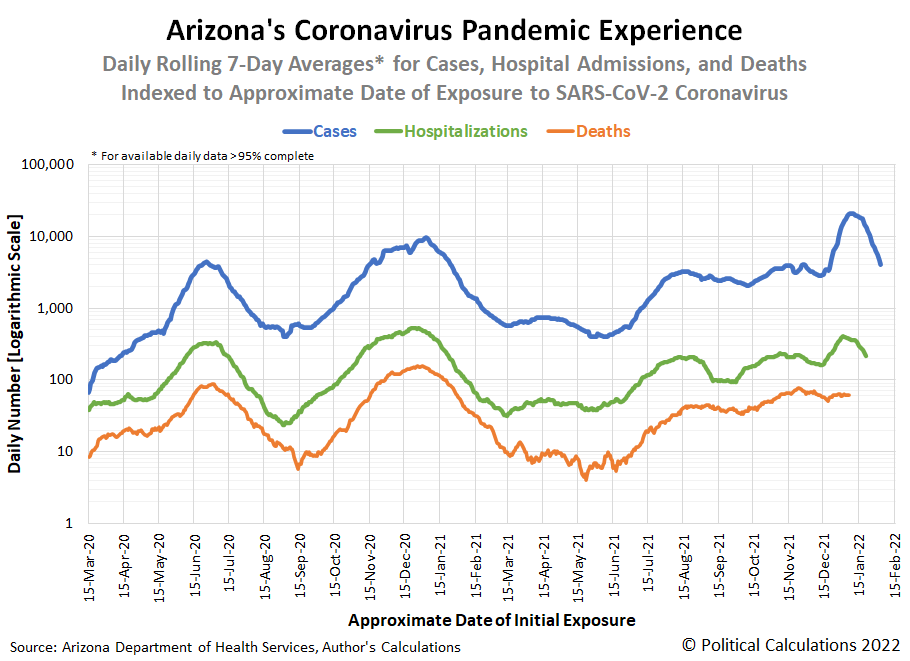
Four weeks ago, we covered the arrival of the Omicron-wave of the coronavirus pandemic in Arizona. Four weeks later, the weak variant is well on its way to fading into the obsurity of history.
Despite being impressively contagious and easy to spread, the Omicron variant of the SARS-CoV-2 coronavirus lacked the severity that characterized previous waves of coronavirus infections in Arizona. We confirm that's the case with the state's high quality data on COVID-related hospitalization and deaths, where we find neither have trended in the state in th elevated way that cases have. We've visualized these data series, where we've aligned the data for each according to when Arizonans who became infected with COVID-19 were most likely first exposed to the viral infection.
Based on Arizona's data for cases, new hospital admissions, and deaths, the Omicron variant of the coronavirus began noticeably spreading approximately in the period from 15 through 19 December 2021. That covers the weekend before the Christmas holiday, which points to public events like shopping, Phoenix' Fiesta Bowl Parade, and pre-holiday social events as the likely venues in which infections of the Omicron coronavirus variant took hold in the state.
After lifting off, the surge in COVID infections went on to peak in the period from 31 December 2021 through 7 January 2022, pointing to the end of the holiday season and its related social gatherings as a leading contributor to what is developing into a rapid decline in the incidence of new infections.
The data for deaths is remarkable because Arizona's wave of delta-variant coronavirus infections has largely blended with the omicron-variant in such a way that the overall trend in deaths has fallen within a relatively narrow range since early November 2021. Or rather, as deaths attributed to the more deadly delta-variant waned, they were replaced almost one-for-one by the much less deadly omicron-variant, where infections were occurring in much higher numbers. We anticipate that pattern will hold until the lagging data for deaths catches up to the rapidly declining trends for both cases and hospitalizations in the state.
Arizona's data for ICU bed usage confirms the rapid decline in omicron-related COVID-19 cases in recent weeks.
While rising in response to Omicron-variant cases, ICU bed usage data points to a lower growth rate for serious cases requiring ICU facilities at this time. The data confirms Arizona's hospitals have maintained high rates of ICU bed utilization, with hospital operators working to keep as many beds occupied with both COVID and non-COVID patients as they could. We have not yet however found any explanation for the reduction in ICU beds in Arizona in mid-December 2021.
We're coming up on the two year anniversary of the coronavirus pandemic in Arizona, which if the positive trends now developing continue to hold, will mark our last regular entry for this series as the pandemic appears to be approaching its end.
Previously on Political Calculations
Here is our previous coverage of Arizona's experience with the coronavirus pandemic, presented in reverse chronological order.
- Omicron Rapidly Fades in Arizona
- Omicron Arrives in Arizona
- Upswing in Arizona COVID Cases Shows Signs of Peaking, Crowded ICUs
- COVID-19 Cases on Upswing in Arizona
- Arizona's COVID Hospital Admissions Unexpectedly Plunge
- All Indicators Confirm COVID Third Wave Receding in Arizona
- Arizona's Third COVID Wave Peaks and Begins to Recede
- Arizona COVID Cases Rising in Third Wave
- Arizona COVID Cases on Slow Uptrend in Summer 2021
- Increase in Arizona COVID Cases from Border Migration Crisis Stabilizing
- COVID-19 and the 2021 Border Migration Crisis in Arizona
- Improving COVID Trends Bottom and Flatline in Arizona
- Surge of Migrants, Lifting of Business Capacity Limits Change Arizona COVID Trends
- COVID-19 in Retreat in Arizona With Vaccines Gaining Traction
- The Ebb and Flow of COVID-19 in Arizona's ICUs
- Arizona's Plunging COVID-19 Caseloads and the Vaccines
- Arizona Enters Downward Trend for COVID-19 After Second Peak
- Arizona Passes Second COVID-19 Peak
- A Tale of Two States and the Coronavirus
- COVID-19 Questions, Answers, and Lessons Learned from Arizona
- The Deadly Intersection of Anti-Police Protests and COVID-19
- 2020 Campaign Events Drive Surge in Arizona COVID Cases
- Arizona Arrives at Critical Junction for Coronavirus Cases
- Arizona To Soon Reach A Critical Junction For COVID-19
- Getting More Than Care from Arizona's COVID ICU Beds
- Arizona's Decentralized Approach to Beating COVID
- Going Back to School with COVID-19
- Arizona Turns Second Corner Toward Crushing Coronavirus
- Arizona's Coronavirus Crest in Rear View Mirror
- The Coronavirus Turns a Corner in Arizona
- A Delayed First Wave Crests in the U.S. and a Second COVID-19 Wave Arrives
- The Coronavirus in Arizona
- A Closer Look at COVID-19 Deaths in Arizona
- The New Epicenter of COVID-19 in the U.S.
- How Long Does a Serious COVID Infection Typically Last?
- How Deadly is the COVID-19 Coronavirus?
- Governor Cuomo and the Coronavirus Models
- How Do False Test Outcomes Affect Estimates of the True Incidence of Coronavirus Infections?
- How Fast Could China's Coronavirus Spread?
References
Political Calculations has been following Arizona's experience with the coronavirus experience from almost the beginning, because the state makes its high quality data publicly available. Specifically, the state's Departent of Health Services reports the number of cases by date of test sample collection, the number of hospitalizations by date of hospital admission, and the number of deaths by date recorded on death certificates.
This data, combined with what we know of the typical time it takes to progress to each of these milestones, makes it possible to track the state's daily rate of incidence of initial exposure to the variants of the SARS-CoV-2 coronavirus using back calculation methods. Links to that data and information about how the back calculation method works are presented below:
Arizona Department of Health Services. COVID-19 Data Dashboard: Vaccine Administration. [Online Database]. Accessed 17 February 2022.
Stephen A. Lauer, Kyra H. Grantz, Qifang Bi, Forrest K. Jones, Qulu Zheng, Hannah R. Meredith, Andrew S. Azman, Nicholas G. Reich, Justin Lessler. The Incubation Period of Coronavirus Disease 2019 (COVID-19) From Publicly Reported Confirmed Cases: Estimation and Application. Annals of Internal Medicine, 5 May 2020. https://doi.org/10.7326/M20-0504.
U.S. Centers for Disease Control and Prevention. COVID-19 Pandemic Planning Scenarios. [PDF Document]. 10 September 2020.
More or Less: Behind the Stats. Ethnic minority deaths, climate change and lockdown. Interview with Kit Yates discussing back calculation. BBC Radio 4. [Podcast: 8:18 to 14:07]. 29 April 2020.
Labels: coronavirus, data visualization
China's fossil fuel shortage has fully reversed. Thanks largely to what is now being described in the media as a "record coal spree", the country is described as now having adequate supplies to get through the winter.
The Chinese government's "coal spree" has produced some stunning numbers for coal imports and domestic production. China's imports of coal sharply increased in 2021, as its imports dipped in December 2021 after peaking in November 2021 as China's domestic coal production soared.
China's fossil fuel shortage prompted officials to crank up domestic coal mining, resulting in record output from coal mines in both December 2021 and for the entire calendar year.
China’s coal output hit record highs in December and in the full year of 2021, as the government continued to encourage miners to ramp up production to ensure sufficient energy supplies in the winter heating season.
China, the world’s biggest coal miner and consumer, produced 384.67 million tonnes of the fossil fuel last month, up 7.2% year-on-year, data from the National Bureau of Statistics showed on Monday. This compared with a previous record of 370.84 million tonnes set in November.
For the full year of 2021, output touched a record 4.07 billion tonnes, up 4.7% on the previous year.
Since October, authorities have ordered coal miners to run at maximum capacity to tame red-hot coal prices and prevent a recurrence of September’s nationwide power crunch that disrupted industrial operations and added to factory gate inflation.
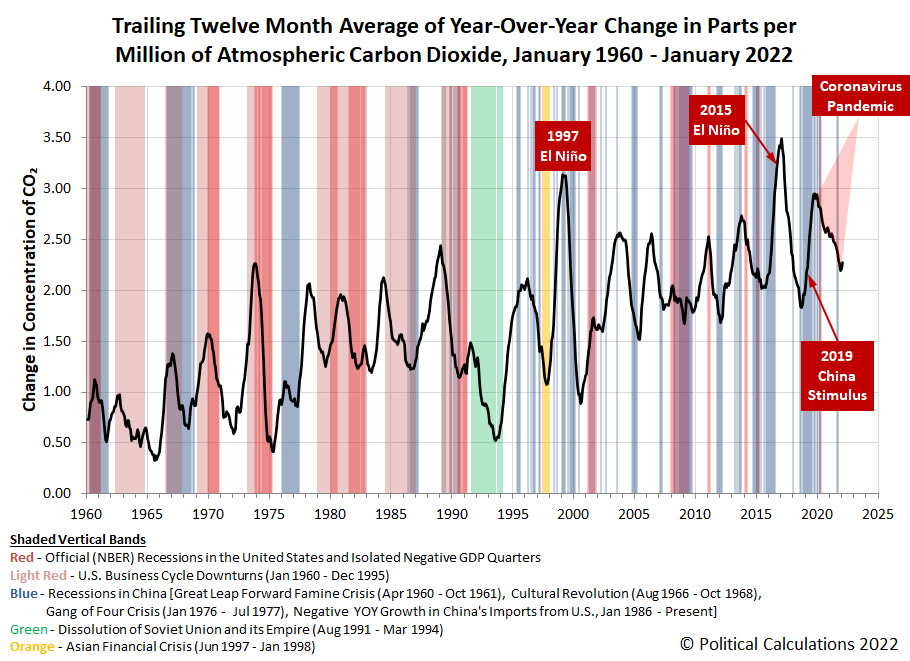
China hasn't let the additional coal it has bought and mined in panic sit around. Chinese power plants have been burning it in great quantities, which has resulted in a very noticable increase in the rate at which carbon dioxide is accumulating in the Earth's atmosphere.
Given its coincidental timing with the waning of the global coronavirus pandemic, the environmental impact of China burning the coal it acquired through it's coal spree may also finally mark the bottom of the coronavirus pandemic itself.
Since we happen to be at an anniversary date for the data, we'll close by presented an updated version of this chart, which spans back to January 1960 to provide additional historic context.
References
National Oceanographic and Atmospheric Administration. Earth System Research Laboratory. Mauna Loa Observatory CO2 Data. [Text File]. Updated 8 February 2022. Accessed 8 February 2022.
Labels: coronavirus, economics, environment
Price increases promised by Campbell Soup (NYSE: CPB) CEO Mark Clouse back in December 2021 arrived at grocery stores across the United States in February 2022. We're seeing price hikes of 19%-25% for Campbell's condensed tomato soup at major grocery store chains, which rank among the highest nominal price increases recorded in the product's 124 year history.
For the latest in our coverage of Campbell's Tomato Soup prices, follow this link!
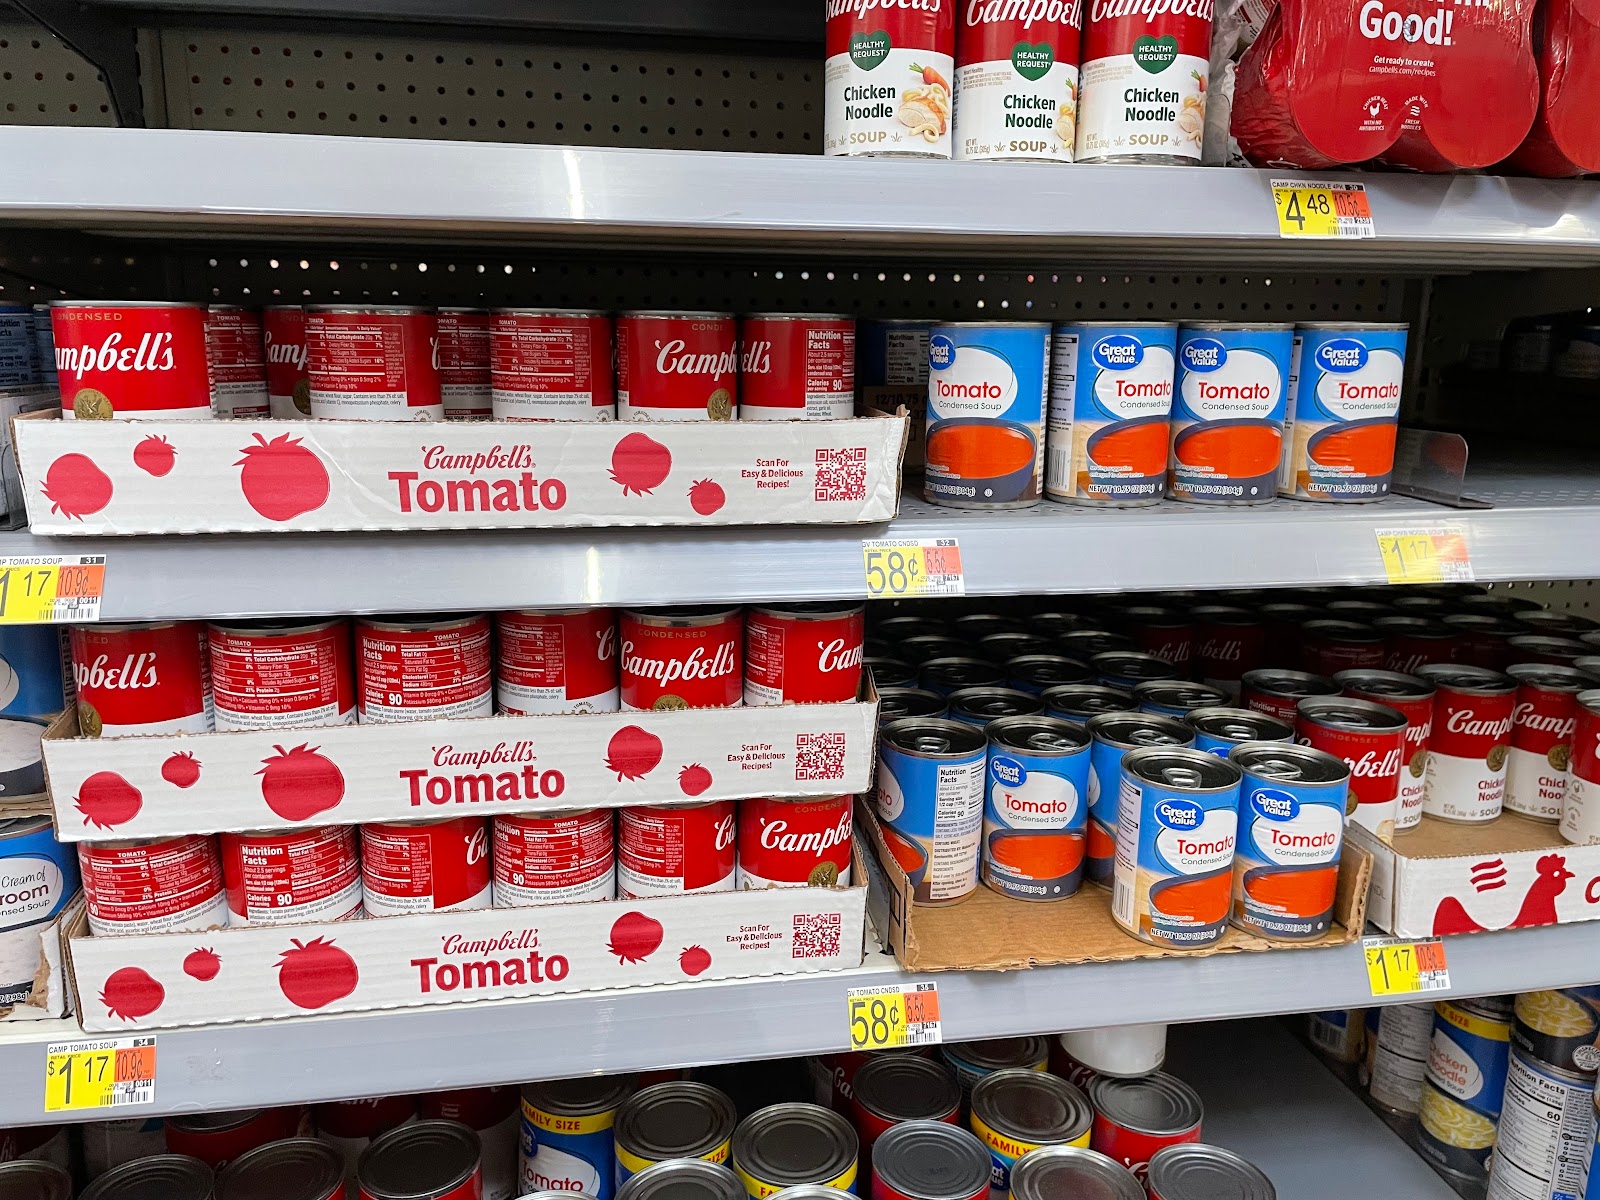
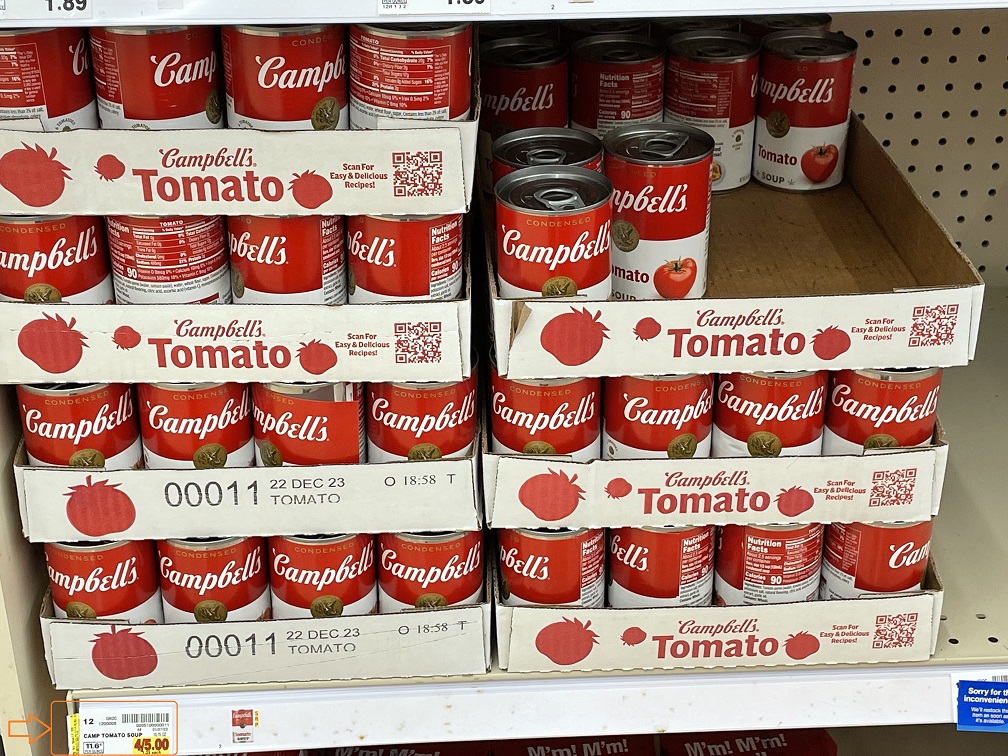
The most notable shelf price inflation for products like Campbell's Condensed Tomato Soup have taken place at Walmart and at Kroger locations across the U.S. The following photos document the new non-discount shelf prices our field correspondent indicates have taken effect this month at their local Walmart supercenter and Kroger-family supermarket:
Walmart has increased its price from $0.98 to $1.17 per 10.75 ounce can, an increase of 19.3%. Kroger's new price is listed as 4 cans for $5.00, which works out to $1.25 per can, a 25% increase over its previous shelf price indicating 10 cans could be bought for $10.00 (or $1.00 per can).
These price changes are significant to American consumers because Walmart sells the most groceries in the U.S., while the Kroger family of grocery stores is considered to be the largest supermarket chain (Walmart's stores fall into a different retail classification, otherwise it would rank at the top). Together, Walmart and Kroger are the top sellers of groceries in the United States.
Since we survey Campbell's tomato soup prices at many more than just two sellers, here's the summary of prices we surveyed at ten major retailers in February 2022 ranked by seller according to their annual sales, along with the change in price at each since our previous snapshot. The most important thing to note is that the discounted sale price per 10.75 ounce can ranges from $0.99 to $1.49 per can, as discounted sale pricing below $0.99 per can has mostly disappeared in American grocery stores:
- Walmart: $1.17/each, up $0.19 (+19.3%)
- Amazon: $0.99/each, up $0.10 (+11.2%)
- Kroger: $1.25/each, up $0.25 (+25%)
- Walgreens: $1.50/each, up $0.01 (+0.7%)
- Target: $0.99/each, unchanged
- CVS: $1.49/each (discounted from $1.79)
- Albertsons: $1.25/each, up $0.25 (+25%)
- Food Lion: $1.00/each (discounted from $1.29)
- H-E-B: $1.01/each (first listing)
- Meijer: $1.29/each, unchanged
The trailing twelve month average for a can of Campbell's condensed tomato soup spiked upward to $0.99 per can in February 2022. We anticipate it will blow through the one-dollar-per-can price level in the next month, as President Biden's inflation penetrates through to all American consumers.
Previously on Political Calculations
Political Calculations' analysis of Campbell's Tomato Soup dates back to 2015, when we first posted historic prices for a No. 1 can of Campbell's condensed tomato soup going back to January 1898! Since then, we've filled in the gaps we originally had in the historic price data and have explored America's second-most popular soup from a lot of different angles.
- The Price of Campbell's Tomato Soup Since 1897 (2015)
- The Tomato Soup Standard (2015)
- The First Ad Ever for Campbell's Condensed Tomato Soup (2015)
- War and Soup (2015)
- Working Backwards from Retail to Cost (2015)
- Early Advertising Milestones for Campbell's Condensed Soups
- Updated: The Price of Campbell's Tomato Soup Since 1897 (2016)
- Everyday Low Prices (2017)
- Soup and Recession (2017)
- Soup and Steel Tariffs (2018)
- Tomato Soup, Oil and Inflation (2018)
- Celebrating 150 Years of the Campbell's Soup Company (2019)
- The Price History of Campbell's Tomato Soup (2020)
- Campbell's Tomato Soup Sales Soar as Americans Prep for Home Quarantines (2020)
- Campbell's Soup Presents "The Magic Shelf" (2020)
- The Price of Campbell's Tomato Soup in the Coronavirus Pandemic (2021)
- The Pandemic Price Escalation of Campbell's Tomato Soup (2021)
- Shrinkflation and a New Tool to Track Price Inflation in Real Time (2021)
- Absence of Discounts Confirms Tomato Soup Inflation (2021)
- The Ship of Theseus and Campbell's Tomato Soup (2021)
- The S&P 500 and Campbell's Tomato Soup (2021)
- Upward Price Pressure at the Start of Soup Season (2021)
- Recent Price Trends for Campbell's Tomato Soup (2021)
- The Price History of Campbell's Tomato Soup (2022)
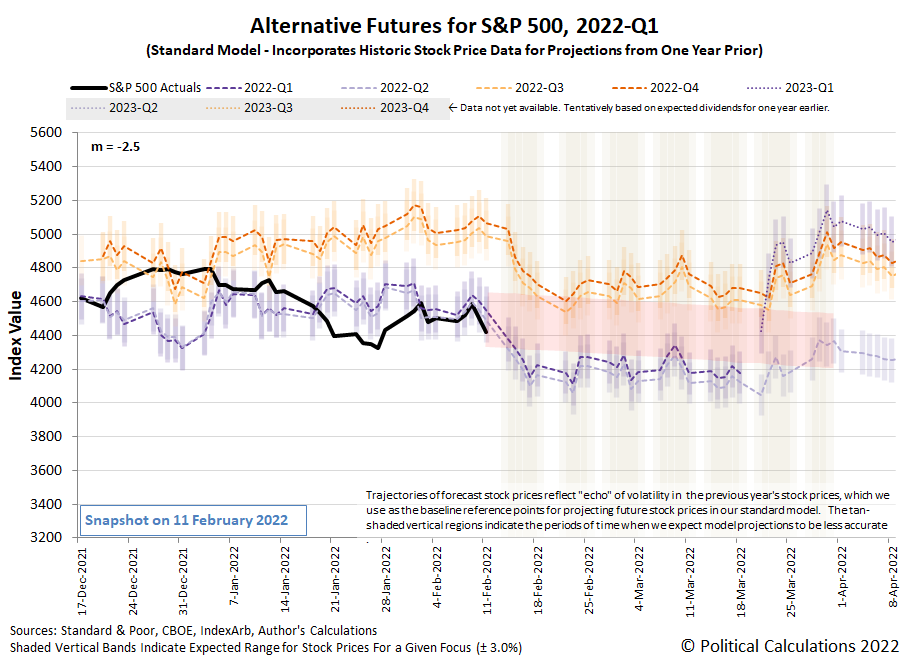
The highest year-over-year inflation since 1982 has resolved a question we had about investor expectations for the S&P 500 (Index: SPX).
We had been debating whether the sharp decline in U.S. stock prices after Federal Reserve Chair Jerome Powell spoke marked a significant shift in how investors weight the future or if it was a noisy outlier event in a longer established trend. The news of the past week however has resolved the question by giving us enough additional data points: it was a noisy outlier event.
We're able to make that determination because the trajectory of the S&P 500 during the past week has closely tracked the alternate trajectories associated with investors focusing on either 2022-Q1 or 2022-Q2 according to how they would be set if the trend established since 16 June 2021 has remained intact. The following chart reveals the close correlation that has developed:
As you can see however, we've now reached a point where we have a very different challenge to sort out. Since the dividend futures-based model behind these trajectories uses historic stock prices as the base reference points from which its projections of the future are made, its accuracy is affected by the "echoes" of past volatility in stock prices. We've added the redzone forecast range to this chart to compensate for that effect, which assumes investors will continue focusing on the upcoming two quarters of 2022-Q1 and Q2 through the end of March 2022, which makes sense given the likely timing and uncertainty associated with the Fed's upcoming rate hikes to deal with President Biden's inflation.
Here's our wrap-up of the past week's market moving headlines:
- Monday, 7 February 2022
-
- Signs and portents for the U.S. economy:
- U.S. stock market liquidity 'abysmal,' adding to volatility risk
- Exclusive: U.S. calls for 'concrete action' from China on trade deal
- Bigger trouble developing in the Eurozone:
- ECB minion predicts Eurozone rate hike in 2022-Q4:
- Wall Street ends lower as Meta weighs
- Tuesday, 8 February 2022
-
- Signs and portents for the U.S. economy:
- U.S. small business sentiment drops to 11-month low -NFIB
- U.S. banks outlook positive with loan growth and rate hikes in view
- As oil nears $100 a barrel, U.S. drillers get busy in costly shale basins
- Wall Street ends higher; bank stocks rise with Treasury yields
- Wednesday, 9 February 2022
-
- Signs and portents for the U.S. economy:
- U.S. crude stockpiles drop unexpectedly, demand hits record high - EIA
- U.S. 4-week oil product supplied rises to record high - EIA
- Column-Diesel is the U.S. economy’s inflation canary: Kemp
- U.S. and Canada fear economic damage from border crossing protest
- Fed minions hope inflation will go away, confidently predict 2%+ inflation through 2023, open to digital dollar, not talking about personal trading:
- Fed hopes economy is on cusp of inflation slowdown as rate hikes loom
- Fed's Mester says she doesn't see compelling case to start with 50 bps rate hike
- Fed's Bowman: keeping 'open mind' on central bank digital currency
- Fed denies release of correspondence on pandemic trades made by policymakers
- BOJ minion says China's COVID policies are harming the global economy:
- ECB minions stricken with panic:
- Wall Street ends sharply higher, lifted by Big Tech
- Thursday, 10 February 2022
-
- Signs and portents for the U.S. economy:
- Ford, Toyota halt some output as U.S., Canada warn on trucker protests
- Jan US CPI shows biggest yearly rise in 4 decades
- U.S. rate futures lift chances of 50 bps hike in March after strong CPI data
- Biden says consumer inflation report shows budgets of Americans are 'being stretched'
- U.S. mortgage rates jump to two-year high, further squeezing buyers
- Explainer-The U.S. yield curve has been flattening: Why you should care
- Fed minions put more, bigger rate hikes on the table to fight inflation, sends a signal about what trouble they expect banks to have to deal with:
- Hot inflation jump-starts case for 'big-bang' Fed rate hike in March
- Fed to stress test banks against commercial real estate, corporate debt troubles in 2022
- Bigger trouble developing in the Eurozone:
- EU exec cuts 2022 euro zone growth forecast, sharply raises inflation view
- Germany's industrial order backlog the highest since 1969 - Ifo
- BOJ minions not wanting to stop endless stimulus policies:
- ECB minions want to go slow to quelch inflation, worry about hackers:
- Better to normalise monetary policy step-by-step, ECB's Rehn says
- Euro zone inflation doesn't require significant policy tightening, ECB's Lane says
- ECB tells banks to step up defences against hacks
- Wall Street ends down sharply on fears of aggressive Fed rate hikes
- Friday, 11 February 2022
-
- Signs and portents for the U.S. economy:
- Goldman ups Fed hike forecast to 7 rate increases in 2022 after CPI data
- Russia now has enough forces for Ukraine invasion, says White House
- Oil soars 3% to 7-yr highs on Ukraine jitters, tight supplies
- ANALYSIS-Truckers at Ambassador Bridge in perfect spot to threaten U.S.- Canada trade
- Fed minions made stock market bets while setting monetary policy in 2020:
- Bigger stimulus rolling out in China:
- Wall Street drops, oil prices jump on Ukraine conflict worries
As of the close of trading on 11 February 2022, the CME Group's FedWatch Tool projects a half-point rate hike in March 2022 (2022-Q1), followed by quarter point rate hikes in May 2022 (2022-Q2), June 2022 (2022-Q2), July 2022 (2022-Q3), September 2022 (2022-Q3) and December (2022-Q4). If you weren't counting, that's six rate hikes in 2022.
On a more positive note, the Atlanta Fed's GDPNow tool shows real GDP growth of 0.7% for the current first quarter of 2022 (as of 9 February 2022), thanks largely to updated wholesale trade data.
Welcome to the blogosphere's toolchest! Here, unlike other blogs dedicated to analyzing current events, we create easy-to-use, simple tools to do the math related to them so you can get in on the action too! If you would like to learn more about these tools, or if you would like to contribute ideas to develop for this blog, please e-mail us at:
ironman at politicalcalculations
Thanks in advance!
Closing values for previous trading day.
This site is primarily powered by:
CSS Validation
RSS Site Feed
JavaScript
The tools on this site are built using JavaScript. If you would like to learn more, one of the best free resources on the web is available at W3Schools.com.
